Here's what I did.
First, try assigning it to projection epsg:3857 - this is what Google Maps uses, and is in metres. So I did:
projection(add)="+init=epsg:3857"
Now I can transform that to lat-long and see where on the earth it thinks it is:
> bbox(spTransform(add,"+init=epsg:4326"))
       min      max
x 34.12644 54.06393
y 28.78893 36.04800
Okay, that's the wrong place. Kentucky is 89W to 82W, a span of 7 degrees, but this was making it about 20 degrees. A factor of three. Which is about the same factor as metres to feet. So I figured it might be one of those American state coordinate systems that uses feet rather than metres.
A little searching led me to EPSG:3091...
http://spatialreference.org/ref/epsg/3091/
So let's reassign and see where that projects to:
> projection(add)="+init=epsg:3091"

> bbox(spTransform(add,"+init=epsg:4326"))
        min       max
x -89.57120 -81.96479
y  36.49706  39.14773
Winner winner chicken dinner, as we say over here.
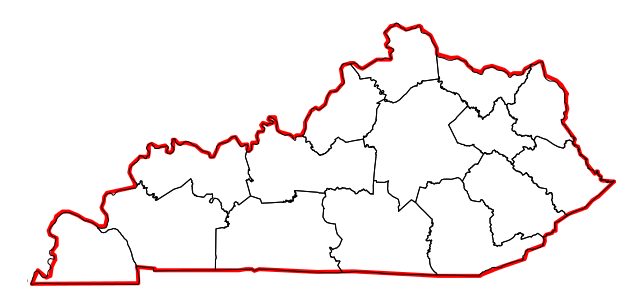
I can plot this on the Kentucky state map from the maps package:
> library(maps)
> map("state","kentucky", col="red",lwd=4)
> plot(spTransform(add,"+init=epsg:4326"),add=TRUE)

To use it in leaflet you probably need to transform it, so:
add2 = spTransform(add, "+init=epsg:4326")
gives you add2 in lat-long coordinates.
If you want to create a .prj file so that reading the shapefile results in the correct projection, download it from the ".PRJ file" link on the spatial reference web site: http://spatialreference.org/ref/epsg/3091/prj/
It should look something like this:
PROJCS["NAD83(HARN) / Kentucky Single Zone (ftUS)",GEOGCS["NAD83(HARN)",DATUM["D_North_American_1983_HARN",SPHEROID["GRS_1980",6378137,298.257222101]],P
RIMEM["Greenwich",0],UNIT["Degree",0.017453292519943295]],PROJECTION["Lambert_Conformal_Conic"],PARAMETER["standard_parallel_1",37.08333333333334],PARAM
ETER["standard_parallel_2",38.66666666666666],PARAMETER["latitude_of_origin",36.33333333333334],PARAMETER["central_meridian",-85.75],PARAMETER["false_ea
sting",4921250],PARAMETER["false_northing",3280833.333],UNIT["Foot_US",0.30480060960121924]]


plot(add)and see anything? That should draw a basic plot on the R graphics window. Shapefiles should have more than just a .shp file, there should be a .shx and a .dbf and a .prj file all together. Have you got any of them?bbox(add)tell you? That should give the coordinates of the bounds of the data, and if it looks like degrees lat-long then I can tell you what to do next. If its big numbers (like metres or feet) then some thought required...bbox(add)min maxx 3798938 6018369y 3348809 4307228