I have a MapServer based application using OpenLayers to display above OpenStreetMap what MapServer render from a PostGIS Database.
It is loading in the right place, but it keeps resizing when zoom in or out in OpenLayers.
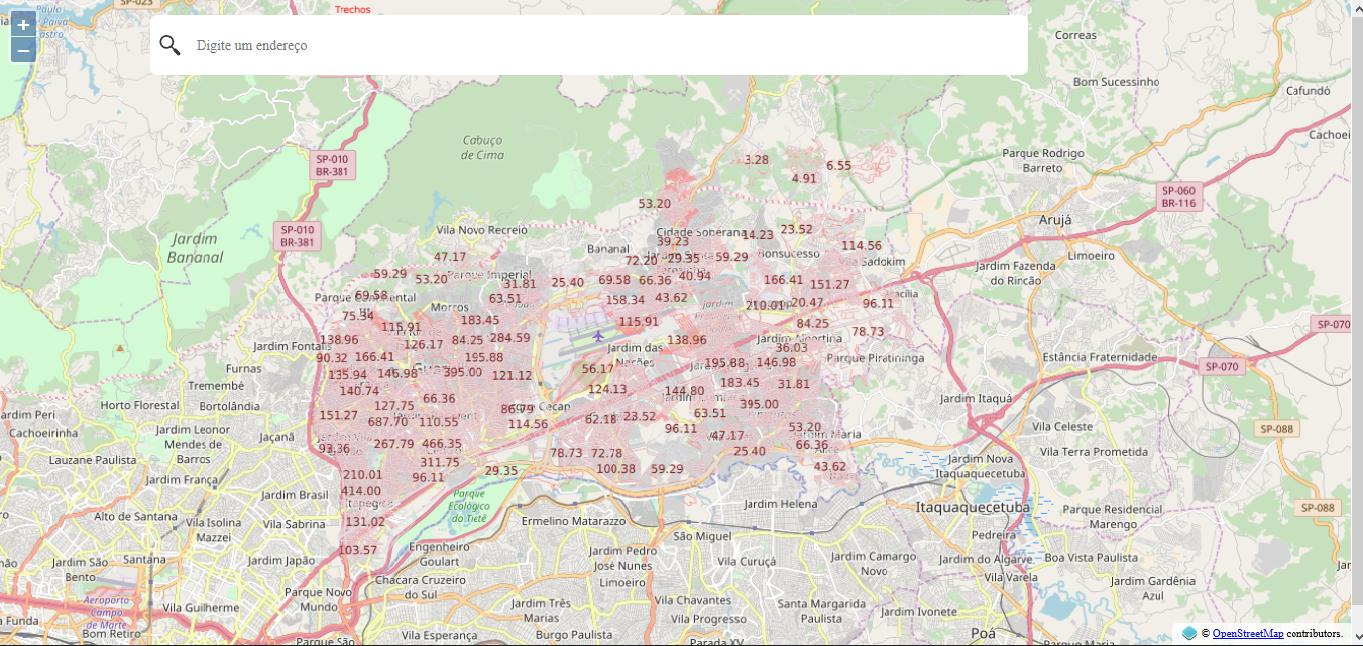
This is when the map finish to load, any zoom is applied:
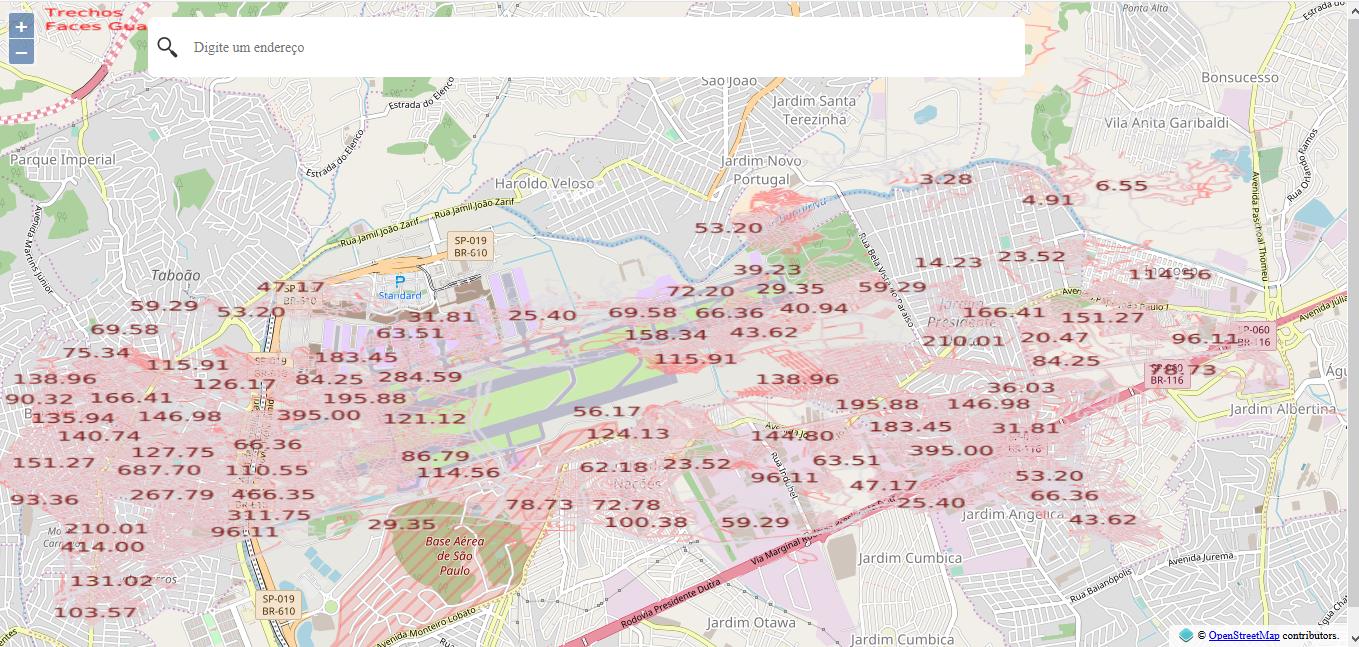
And this is when I zoom in on map:
What I need? I need something to make it stop resizing this way. The map CAN NOT be able to fit the screen in this non sense shape. As you can see in the first image, it is respecting the city shape, but the second image (with zoom in) it does not respect it anymore. I need it keeps respecting the real city shape all the time no matter how many zoom levels I put in.
To make it as clearly as possible: In the first image what you see in red with some numbers above it is my layer rendered on MapServer from the mapfile below, and in this image it is show as it has to be. But in second image is the same layer from the first image, but now it is deformed and do not respect what it is supposed to show. The second image is the first but with zoom in, note that the layer I just described does not is affected by the zoom, the zoom does not get closer to it, the zoom get closer to the base layer (the OSM layer) but to the layer rendered from MapServer do not.
This is my map html
<html>
<head>
<title>Guarulhos</title>
<meta charset="utf-8" />
<link rel="stylesheet" href="https://openlayers.org/en/v4.4.2/css/ol.css" type="text/css">
<link href="https://cdn.jsdelivr.net/npm/ol-geocoder@latest/dist/ol-geocoder.min.css" rel="stylesheet">
<link rel="stylesheet" href="css/mapa.css">
<!-- The line below is only needed for old environments like Internet Explorer and Android 4.x -->
<script src="https://cdn.polyfill.io/v2/polyfill.min.js?features=requestAnimationFrame,Element.prototype.classList,URL"></script>
<script src="https://openlayers.org/en/v4.4.2/build/ol.js"></script>
<script src="https://ajax.googleapis.com/ajax/libs/jquery/3.2.1/jquery.min.js"></script>
<script src="https://cdn.jsdelivr.net/npm/ol-geocoder"></script>
<script src="js/mapa.js"></script>
</head>
<body>
<div class="navbar">
<div class="img">
<img src="./images/logo_guarulhos.png" alt="Unidesk" class="img-responsive logo">
</div>
<div class="user">
Olá <?php echo $user['name']?><br>
<div class="btn-lgout">
<a href="logout.php">Sair</a>
</div>
</div>
</div>
<div id="mapholder">
<div id="map" class="map"></div>
<div id="mouse-position"></div>
</div>
<div id="popup" class="ol-popup">
<a href="#" id="popup-closer" class="ol-popup-closer"></a>
<div id="popup-content"></div>
</div>
<input type="text" id="mapext" value="[mapext]">
<script type="text/javascript">
var container = document.getElementById('popup');
var content = document.getElementById('popup-content');
var closer = document.getElementById('popup-closer');
var myurl = 'http://localhost/cgi-bin/mapserv.exe?map=../htdocs/Guarulhos/mapfile.map';
var exurl = 'https://sampleserver1.arcgisonline.com/ArcGIS/rest/services/Specialty/ESRI_StateCityHighway_USA/MapServer';
var extent = ol.proj.transformExtent([-46.570612, -23.508703, -46.357596, -23.308953], 'EPSG:4326', 'EPSG:3857');
var extent1 = ol.proj.transformExtent([-46.556415 -23.426757 -46.449907 -23.320249], 'EPSG:4326', 'EPSG:3857');
var overlay = new ol.Overlay(/** @type {olx.OverlayOptions} */ ({
element: container,
autoPan: true,
autoPanAnimation: {
duration: 250
}
}));
var geocoder = new Geocoder('nominatim', {
provider: 'osm',
// key: 'mapquest',
lang: 'pt-BR', //en-US, fr-FR
placeholder: 'Digite um endereço',
targetType: 'text-input',
limit: 5,
keepOpen: true
});
closer.onclick = function() {
overlay.setPosition(undefined);
closer.blur();
return false;
};
var osm = new ol.layer.Tile({
source: new ol.source.OSM()
});
// new ol.layer.Image({//this is for testing
// source: new ol.source.ImageArcGISRest({
// ratio: 1,
// params: {},
// url: exurl
// })
// });
var guarulhos = new ol.layer.Image({ //this is my map
source: new ol.source.ImageWMS({
ratio: 1,
params: {
'LAYERS': 'face_guarulhos, pg_trechos',
'mode': 'map',
},
serverType: 'mapserver',
url: myurl,
projection: 'EPSG:4326'
}),
extent: extent,
name: 'face_guarulhos'
});
var mousePositionControl = new ol.control.MousePosition({
coordinateFormat: function(coordinate) {
lon = coordinate[0];
lat = coordinate[1];
lon = lon % 360;
if (lon > 180) {
lon = lon - 360;
} else if (lon < -180) {
lon = 360 + lon;
}
modifiedCoordinate = [lon, lat]
return ol.coordinate.format(modifiedCoordinate, "{x}, {y}", 6);
},
projection: 'EPSG:4326',
// comment the following two lines to have the mouse position
// be placed within the map.
className: 'custom-mouse-position',
target: document.getElementById('mouse-position'),
undefinedHTML: ' '
});
var map = new ol.Map({
controls: ol.control.defaults({
attributionOptions: /** {olx.control.AttributionOption} */({
collapsible: false
})
}).extend([mousePositionControl]),
layers: [osm, guarulhos],
target: 'map',
projection: 'EPSG:3857',
overlays: [overlay],
maxExtent : ol.extent.boundingExtent(extent)
});
map.getView().fit(extent, map.getSize());
map.getView().setResolution(map.getView().getResolutionForExtent(extent, map.getSize()));
map.addControl(geocoder);
geocoder.on('addresschosen', function(evt){
var coord = ol.proj.transform(evt.coordinate, 'EPSG:3857', 'EPSG:4326');
if(testarRange(coord)){
getInfoPoint(evt);
}else {
alert("Fora dos limites!");
var zoom = map.getView().getZoom();
var centro = map.getView().getCenter();
map.getView().setZoom(zoom).setCenter(centro);
}
// overlay.setPosition(coord);
});
map.on('click', function (evt) {
var coord = ol.proj.transform(evt.coordinate, 'EPSG:3857', 'EPSG:4326');
if(testarRange(coord)){
getInfoPoint(evt);
// var rome = new ol.Feature({
// geometry: new ol.geom.Point(ol.proj.fromLonLat(coord))
// });
//
// rome.setStyle(new ol.style.Style({
// text: new ol.style.Text({
// text: 'Hello',
// scale: 1.3,
// fill: new ol.style.Fill({
// color: '#000000'
// })
// })
// }));
//
// var vectorSource = new ol.source.Vector({
// features: [rome]
// });
//
// var vectorLayer = new ol.layer.Vector({
// source: vectorSource,
// name: 'marker'
// });
//
// map.getLayers().forEach(element => {
// if(element.get('name') === 'marker'){
//
// }
// });
//
// map.addLayer(vectorLayer);
console.log(map.getLayers());
}else {
alert("Fora dos limites!");
}
});
map.on('moveend', (function(){
var mapext = sessionStorage.getItem("mapext");
console.log(mapext);
}));
function testarRange(coord) {
var lon = coord[0]; //longitude
var lat = coord[1]; //latitude
if(lon >= -46.570612 && lon <= -46.357596 && lat >= -23.508703 && lat <= -23.308953){
return true;
}else {
return false;
}
}
function getInfoPoint (evt) {
var coordinate = evt.coordinate;
// var data = {'lon': coordinate[0], 'lat': coordinate[1]};
var data = {'lon': lon, 'lat': lat};
$.ajax({
type: "POST",
url: 'coordinates.php',
data: data,
success: function(data)
{
var point = JSON.parse(data);
content.innerHTML ="<label class='top'> Informações </label><br/>"+
"<label class='left'>Quadra</label>"+
"<label class='right'>"+ point.quadra +"</label> "+
"<label class='left'>Valor</label>"+
"<label class='right'>"+point.valor+"</label>"+
"<label class='left'>Face</label>"+
"<label class='right'>"+point.face+"</label>"+
"<label class='left'>Folha</label>"+
"<label class='right'>"+point.folha+"</label>"+
"<label class='left'>Parâmetro</label>"+
"<label class='right'>"+point.parametro+"</label>";
overlay.setPosition(coordinate);
// console.log(point);
}
});
}
</script>
</body>
</html>
And this is my mapfile
    MAP
    NAME "guarulhos"
    EXTENT -46.570612 -23.508703 -46.357596 -23.308953
    #EXTENT 339574.172100 7399304.302223 361316.525900 7421573.107621
    SIZE 800 800

    QUERYMAP
        STATUS on
        STYLE normal
    END

    UNITS METERS
  SHAPEPATH "data/"
  IMAGECOLOR 155 155 155

  OUTPUTFORMAT
    NAME "png"
    DRIVER AGG/PNG
    MIMETYPE "image/png"
    IMAGEMODE RGB
    EXTENSION "png"
    FORMATOPTION "GAMMA=0.75"
    TRANSPARENT ON
  END

#  SCALEBAR
#      IMAGECOLOR 255 255 255
#      LABEL
#          COLOR 0 0 0
#          SIZE SMALL
#      END
#      SIZE 150 5
#      COLOR 255 255 255
#      BACKGROUNDCOLOR 0 0 0
#      OUTLINECOLOR 0 0 0
#      UNITS kilometers
#      INTERVALS 5
#      STATUS EMBED
#  END

  LEGEND
    STATUS EMBED
    POSITION UL
    KEYSIZE 18 12
    LABEL
      TYPE BITMAP
      SIZE MEDIUM
      COLOR 255 0 0
    END
  END

  WEB
    TEMPLATE "template.html"
        IMAGEPATH "/ms4w/tmp/ms_tmp/"
    IMAGEURL "/ms_tmp/"
        METADATA
            "wms_title" "wms guarulhos"
            "wms_onlineresource" "localhost/cgi-bin/mapserv.exe?map=../htdocs/Guarulhos/mapfile.map"
            "wms_srs" "EPSG:4326 EPSG:3857"
            #"wms_srs" "EPSG:31983"
        END
  END

    PROJECTION
        "init=epsg:4326"
        #"init=epsg:31983"
    END

  LAYER
    NAME face_guarulhos
    TYPE line
    CONNECTIONTYPE postgis
    CONNECTION "db stuff"
    DATA "geomlatlon from ctageo.face_guarulhos"
        LABELITEM "vu_2017_uf"
    STATUS default

        METADATA
            "wms_title" "face_guarulhos"
        END

    CLASS
      NAME "Faces Guarulhos"
            OUTLINECOLOR 139 134 130
      COLOR 255 145 145

            LABEL
          COLOR 132 31 31
          SHADOWCOLOR 218 218 218
          SHADOWSIZE 2 2
          TYPE truetype
          #FONT "sans"
          SIZE 12
          ANTIALIAS TRUE
          POSITION CL
          PARTIALS FALSE
          MINDISTANCE 300
          BUFFER 4
        END
    END

  END

    LAYER
        NAME pg_trechos
        TYPE line
        CONNECTIONTYPE postgis
        CONNECTION "db stuff"
        DATA "geomlatlon from transporte.pg_trechos"
        STATUS default

        METADATA
            "wms_title" "pg_trechos"
        END

        CLASS
            NAME "Trechos"
            OUTLINECOLOR 46 33 255
            COLOR 226 225 232
        END
    END

END
This is the clearest that I can be in another language without showing in video what happens. I hope someone can help me now.


