0

I recently downloaded the shapefiles for San Francisco from Mapzen. Now I am able to display the streets, but I would like to have a real map as a background image, such that it is easier to make the link between the real roads from San Francisco and the ones shown by GeoPandas.

Here is the code to show the streets with GeoPandas:

  1. First download the shapefile from Mapzen: https://s3.amazonaws.com/metro-extracts.mapzen.com/san-francisco_california.imposm-shapefiles.zip
  2. Open a Python notebook and add those lines:

     #Useful starting lines
     %matplotlib inline
     import numpy as np
     import matplotlib.pyplot as plt
     %load_ext autoreload
     %autoreload 2
    
  3. Load the street map:

    shapefile_dir = 'the path to your directory where you store the shapefile'

    shapefile_name ='san-francisco_california_osm_roads_gen0.shp'
    shapefile_roads = os.path.join(shapefile_dir, shapefile_name)
    
  4. Import as a geopandas dataframe:

    import os
    import geopandas as gpd
    
    df = gpd.GeoDataFrame.from_file(shapefile_roads)
    
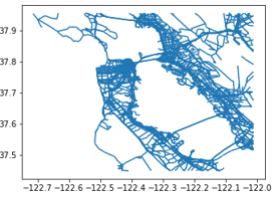
  5. Simply plot the street network:

    df.plot();
    

The output should be:

enter image description here

Now I would like to have a real map (Color map) as a background. How can I do it?

2
  • Do you need an image format ouput or you just want to inspect it? If latter, the easiest and best way it to use Folium. It plots geographic features on a live OpenStreetMap in Jupyter Notebook. Check out this link for more info: github.com/python-visualization/folium/blob/master/examples/…
    – Alz
    Commented Dec 11, 2017 at 14:19
  • @AlirezaSohofi Thank you very much for this link. How would you apply folium in my case ? Would you mind to create an aswer ? This would be very helpful, because I am quiet new to this. Thanks a lot !
    – james
    Commented Dec 11, 2017 at 14:24

1 Answer 1

1

After loading the data, you can use the following function to plot geographic features on live OSM map in Jupyter Notebook using Folium:

def plot_gdf_folium(gdf, center):
    m = folium.Map(center, zoom_start=10, tiles='OpenStreetMap')
    folium.GeoJson(gdf).add_to(m)
    return m

One limitation is that it doesn't work with large files, I am not quite sure what it the reason though. Note that the argument center is where the center of the resulting map is placed, for San Francisco, you may want to use: [37.784160, -122.442432].

UPDATE

To compute the center from gdf:

bo = gdf.total_bounds
center = (bo[1] + bo[3])/2, (bo[0] + bo[2])/2
4
  • Thanks a lot !! How did you find the Center ?
    – james
    Commented Dec 11, 2017 at 15:03
  • @totyped You can Google it.
    – Alz
    Commented Dec 11, 2017 at 15:04
  • Is there no way to extract the Center from the geopandas dataframe ? ...because I don't know the Center if I map a small town or a arbitrary strip of land.
    – james
    Commented Dec 11, 2017 at 15:09
  • @totyped see update
    – Alz
    Commented Dec 11, 2017 at 15:38

Your Answer

By clicking “Post Your Answer”, you agree to our terms of service and acknowledge you have read our privacy policy.

Not the answer you're looking for? Browse other questions tagged or ask your own question.