15

I have two classes sharing the same CRS (Latitute and Longitude):

  1. bolognaQuartieriMap: a SpatialPolygonDataFrame containing data of a city boroughts.
  2. crashPoints: a SpatialPointsDataFrame containing data of accidents.

They are well plotted using:

plot(bolognaQuartieriMap)
title("Crash per quartiere")
plot(crashPoints, col="red",add=TRUE)

What I need is to get the number of points (crashPoints) in each polygon that constitute bolognaQuartieriMap. I was suggested to use over() but I did not succeed.

0

3 Answers 3

28

Since you didn't provide a reproducible example nor an error message, see if this code snippet gets you started:

library("raster")
library("sp")

x <- getData('GADM', country='ITA', level=1)
class(x)
# [1] "SpatialPolygonsDataFrame"
# attr(,"package")
# [1] "sp"

set.seed(1)
# sample random points
p <- spsample(x, n=300, type="random")
p <- SpatialPointsDataFrame(p, data.frame(id=1:300))

proj4string(x)
# [1] " +proj=longlat +ellps=WGS84 +datum=WGS84 +no_defs +towgs84=0,0,0"
proj4string(p)
# [1] " +proj=longlat +ellps=WGS84 +datum=WGS84 +no_defs +towgs84=0,0,0"

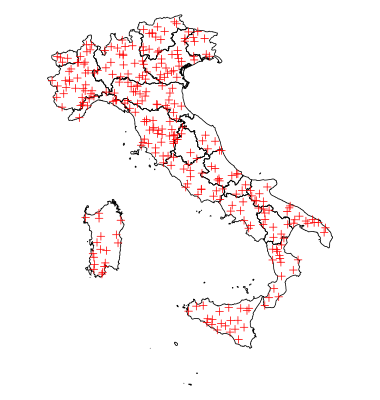
plot(x)
plot(p, col="red" , add=TRUE)

plot

res <- over(p, x)
table(res$NAME_1) # count points
#               Abruzzo                Apulia            Basilicata
#                    11                    20                     9
#              Calabria              Campania        Emilia-Romagna
#                    16                     8                    25
# Friuli-Venezia Giulia                 Lazio               Liguria
#                     7                    14                     7
#             Lombardia                Marche                Molise
#                    22                     4                     3
#              Piemonte              Sardegna                Sicily
#                    35                    18                    21
#               Toscana   Trentino-Alto Adige                Umbria
#                    33                    15                     6
#         Valle d'Aosta                Veneto
#                     4                    22
2
  • 1
    I really really and really again appreciate this answer. Please give my upvote, a thousands thanks. Commented Nov 6, 2018 at 16:21
  • Tried to up vote really fast but didn't work. +100 for this answer. Great and works!
    – John T
    Commented Sep 28, 2020 at 4:20
4

You can achieve the same using the sf package. Check the reproducible and commented code below. The package sf is used to handle spatial objects as simple features objects. In this answer the package raster is used only for download example polygon data and the package dplyr for data transformation at the end.

# Load libraries ----------------------------------------------------------

library(raster)
library(sf)
library(dplyr)

# Get sample data ---------------------------------------------------------

# Get polygon
polygon <- getData('GADM', country='URY', level = 1)[,1] # Download polygon of country admin level 1 
polygon <- st_as_sf(polygon) # convert to sf object
colnames(polygon) <- c("id_polygons", "geometry") # change colnames
polygon$id_polygons <- paste0("poly_", LETTERS[1:19]) #  change polygon ID

# Get sample random poins from polygon bbox
set.seed(4)
bbox <- st_as_sfc(st_bbox(polygon))
points <- st_sample(x = bbox, size = 100, type = "random")
points <- st_as_sf(data.frame(id_points = as.character(1:100)), points) # add points ID

# Plot data ---------------------------------------------------------------

# Plot polygon + points
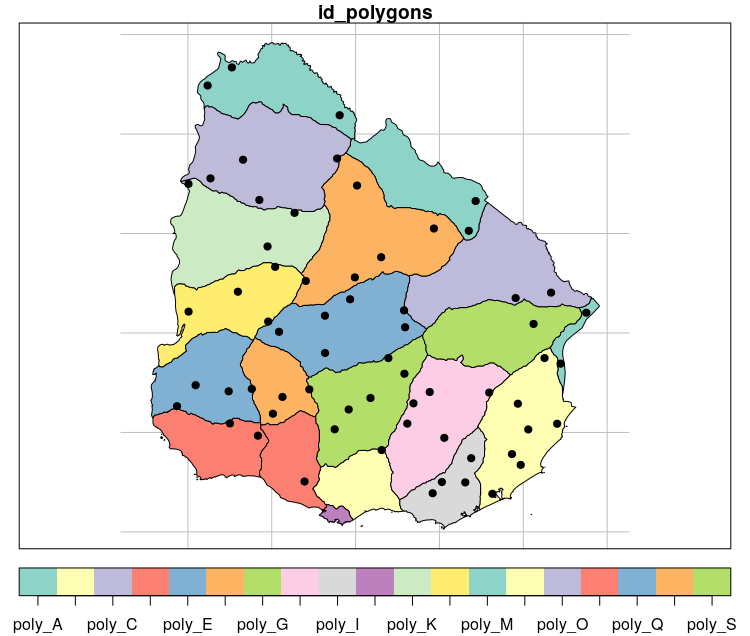
plot(polygon, graticule = st_crs(4326), key.pos = 1)
plot(points, pch = 19, col = "black", add = TRUE)

# Intersection between polygon and points ---------------------------------

intersection <- st_intersection(x = polygon, y = points)

# Plot intersection
plot(polygon, graticule = st_crs(4326), key.pos = 1)
plot(intersection[1], col = "black", pch = 19, add = TRUE)

# View result
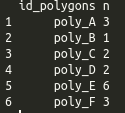
table(intersection$id_polygons) # using table

# using dplyr
int_result <- intersection %>% 
  group_by(id_polygons) %>% 
  count()

as.data.frame(int_result)[,-3]
intersectionresult

intersectionplot

2

I want to leave another option. You can achieve the task using poly.counts() in the GISTools package. Using the sample data by rcs, you can do the following. If you'd look into the function, you'd realize that the function is written as colSums(gContains(polys, pts, byid = TRUE)). So, you can just use gContains() in the rgeos package and colSums().

library(GISTools)

poly.counts(p, x) -> res
setNames(res, x@data$NAME_1)

Or

colSums(gContains(x, p, byid = TRUE)) -> res
setNames(res, x@data$NAME_1)

And the result is:

#              Abruzzo                Apulia            Basilicata 
#                   11                    20                     9 
#             Calabria              Campania        Emilia-Romagna 
#                   16                     8                    25 
#Friuli-Venezia Giulia                 Lazio               Liguria 
#                    7                    14                     7 
#            Lombardia                Marche                Molise 
#                   22                     4                     3 
#             Piemonte              Sardegna                Sicily 
#                   35                    18                    21 
#              Toscana   Trentino-Alto Adige                Umbria 
#                   33                    15                     6 
#        Valle d'Aosta                Veneto 
#                    4                    22 
1
  • This was very helpful indeed. But I'm having trouble saving the results as I would like to plot a choropleth based on the number of points in the polygon
    – qpisqp
    Commented Mar 20, 2017 at 5:16

Your Answer

By clicking “Post Your Answer”, you agree to our terms of service and acknowledge you have read our privacy policy.

Not the answer you're looking for? Browse other questions tagged or ask your own question.