1

I have a shapefile containing 38 polygons i.e. 38 states of a country. This shapefile is overlaid on a raster. I need to extract/reclassify pixel above a certain value, specific to each polygon. For example, I need to extract the raster pixels> 120 for state/polygon 1, pixels> 189 for polygon 2 etc with the resulting raster being the extracted pixels with value 1 and everything else as NoData. Hence, it seems like I need to extract first and then reclassify.

I have the values, for extraction, saved as a data frame with a column containing names, matching the names of the states,which is stored as an attribute "Name" in the shapefile.

Any suggestion on how I could go about this? Should I extract the raster for each state into 38 separate rasters, then do reclassify() and then mosaic to make one raster i.e. the country?

1
  • 1
    Maybe it would be easier to rasterize your shapefile based on one attribute column, to which you can assign the final raster before?
    – s6hebern
    Commented Mar 17, 2018 at 21:23

2 Answers 2

2

Here's a way to do it:

Need these (I'd use sf but raster doesn't play with sf):

> library(rgdal)
> library(sp)
> library(raster)

Make some sample data. Use the scottish boundaries:

> scot_BNG <- readOGR(dsn=dsn, layer="scot_BNG")
OGR data source with driver: ESRI Shapefile 
Source: "/home/rowlings/R/x86_64-pc-linux-gnu-library/3.4/rgdal/vectors", layer: "scot_BNG"
with 56 features
It has 13 fields

And add a field which is your threshold value:

> scot_BNG$thresh = round(runif(nrow(scot_BNG))*100)

Now make a sample raster data, 1km cells, over the area of the polygons:

> r = raster(scot_BNG, res=c(1000,1000))
> r[] = round(runif(317629)*100)

Right. Now we can actually get to the work since we've got data that should be like yours. First make a raster on the same grid as r but with the threshold values from the polygons:

> rp = rasterize(scot_BNG, r, field="thresh")

and then you can do:

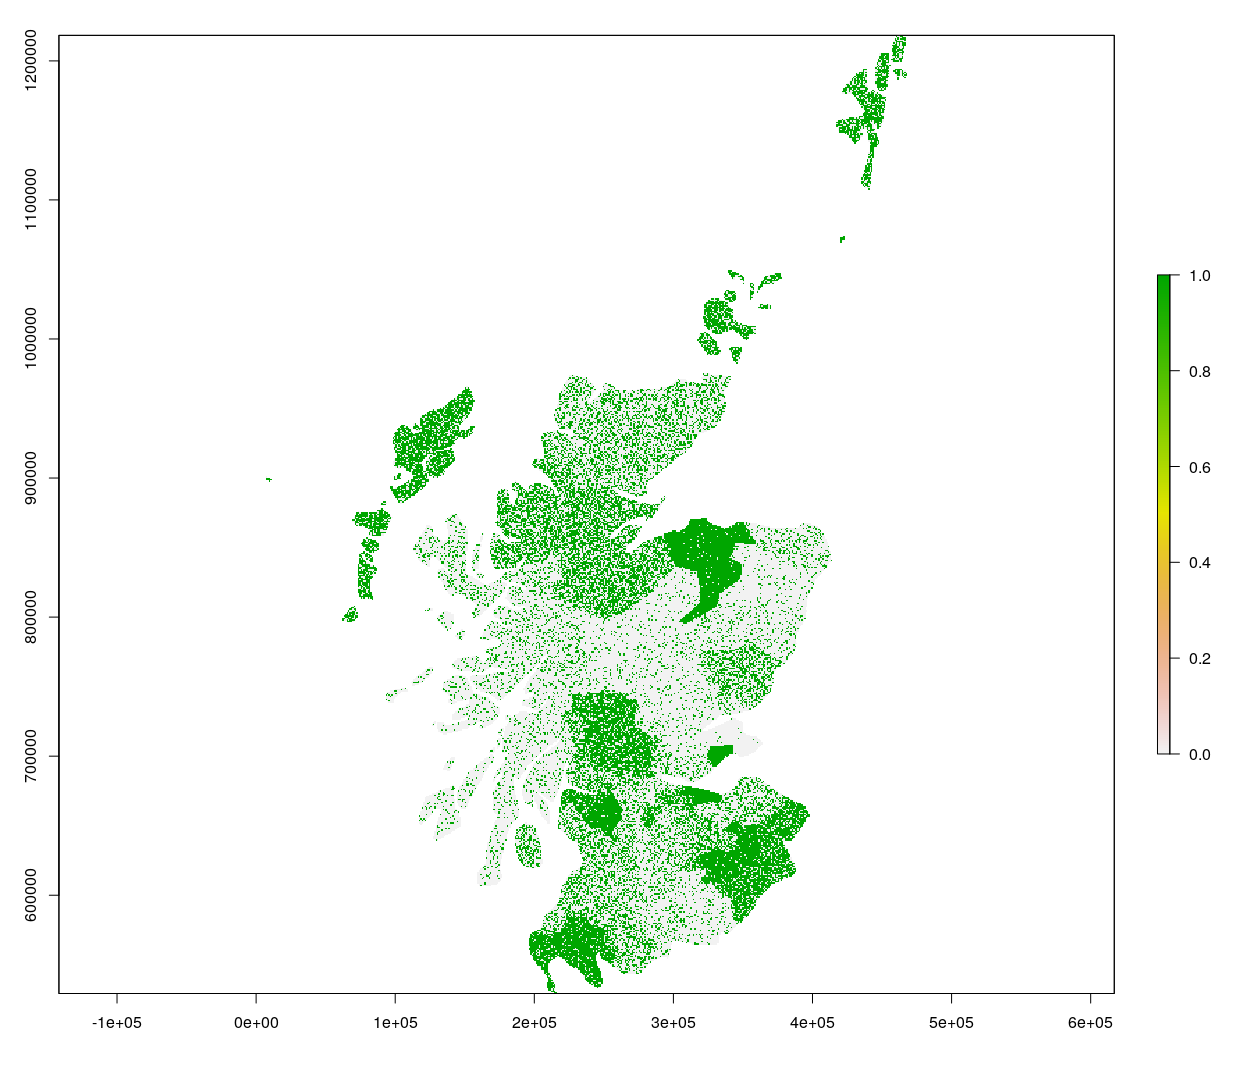
> rt = r > rp
> plot(rt)

grid of values

which is a grid of 1 where the raster is greater than the underlying polygon's threshold value, and zero elsewhere, and nodata where there's nodata in the raster. Converting 0 to nodata is easy enough, or possibly not necessary. Anyway, the trick is rasterizing and then comparing.

1

I prefer @Spacedman's solution however, you should be aware of the cellnumbers argument in raster::extract. If TRUE this argument returns the cell index in the raster. You can then use these index values to replace associated values in the raster.

Let's create some data and plot it.

library(raster)
library(sp)   
p <- raster(nrow=10, ncol=10)
  p[] <- runif(ncell(p)) * 10
    p <- rasterToPolygons(p, fun=function(x){x > 9})
      r <- raster(nrow=100, ncol=100)
        r[] <- runif(ncell(r)) 
plot(r)
  plot(p, add=TRUE, lwd=4) 

Now, using extract we can create a list object, containing dataframes, with the cell ids and associated raster values.

( pv <- extract(r,p,cellnumbers=TRUE) )

We then write a simple function to apply the desired threshold (in this case using the +/- mean), and then pass it to lapply.

thresh <- function(x) {
  data.frame(cell=x[,"cell"], class=ifelse( x[,"value"] >= mean(x[,"value"]), 1, 0))  
} 
( p.thresh <- lapply( pv, FUN=thresh) )

Using the resulting classified list we can replace the values in the raster. If you want an NA background just assign it first ie., r[] <- NA

  for(i in 1:length(p.thresh)) {
    r[p.thresh[[i]][,1]] <- p.thresh[[i]][,2] 
  }

Plot results

plot(r)
  plot(p, add=TRUE, lwd=4) 

Your Answer

By clicking “Post Your Answer”, you agree to our terms of service and acknowledge you have read our privacy policy.

Not the answer you're looking for? Browse other questions tagged or ask your own question.