6

I'm new to GIS and I have a question related to the use of different programs (R, QGIS and ArcGIS) to do summary statistics. I've used R and QGIS to sum the cell values of my raster (using respectively the cellStats function from R (as follows) and the Raster layer statistics from the QGIS toolbox) and in both cases I get the same result.

Following is a link to the data I'm using: https://1drv.ms/u/s!Aod2icrdkQPXgSDjgZg3O_NIO71Y

In R, I do (with raster package):

my_raster <- raster("path_to_my_raster") 
sum_raster_cells <-cellStats(my_raster, 'sum')

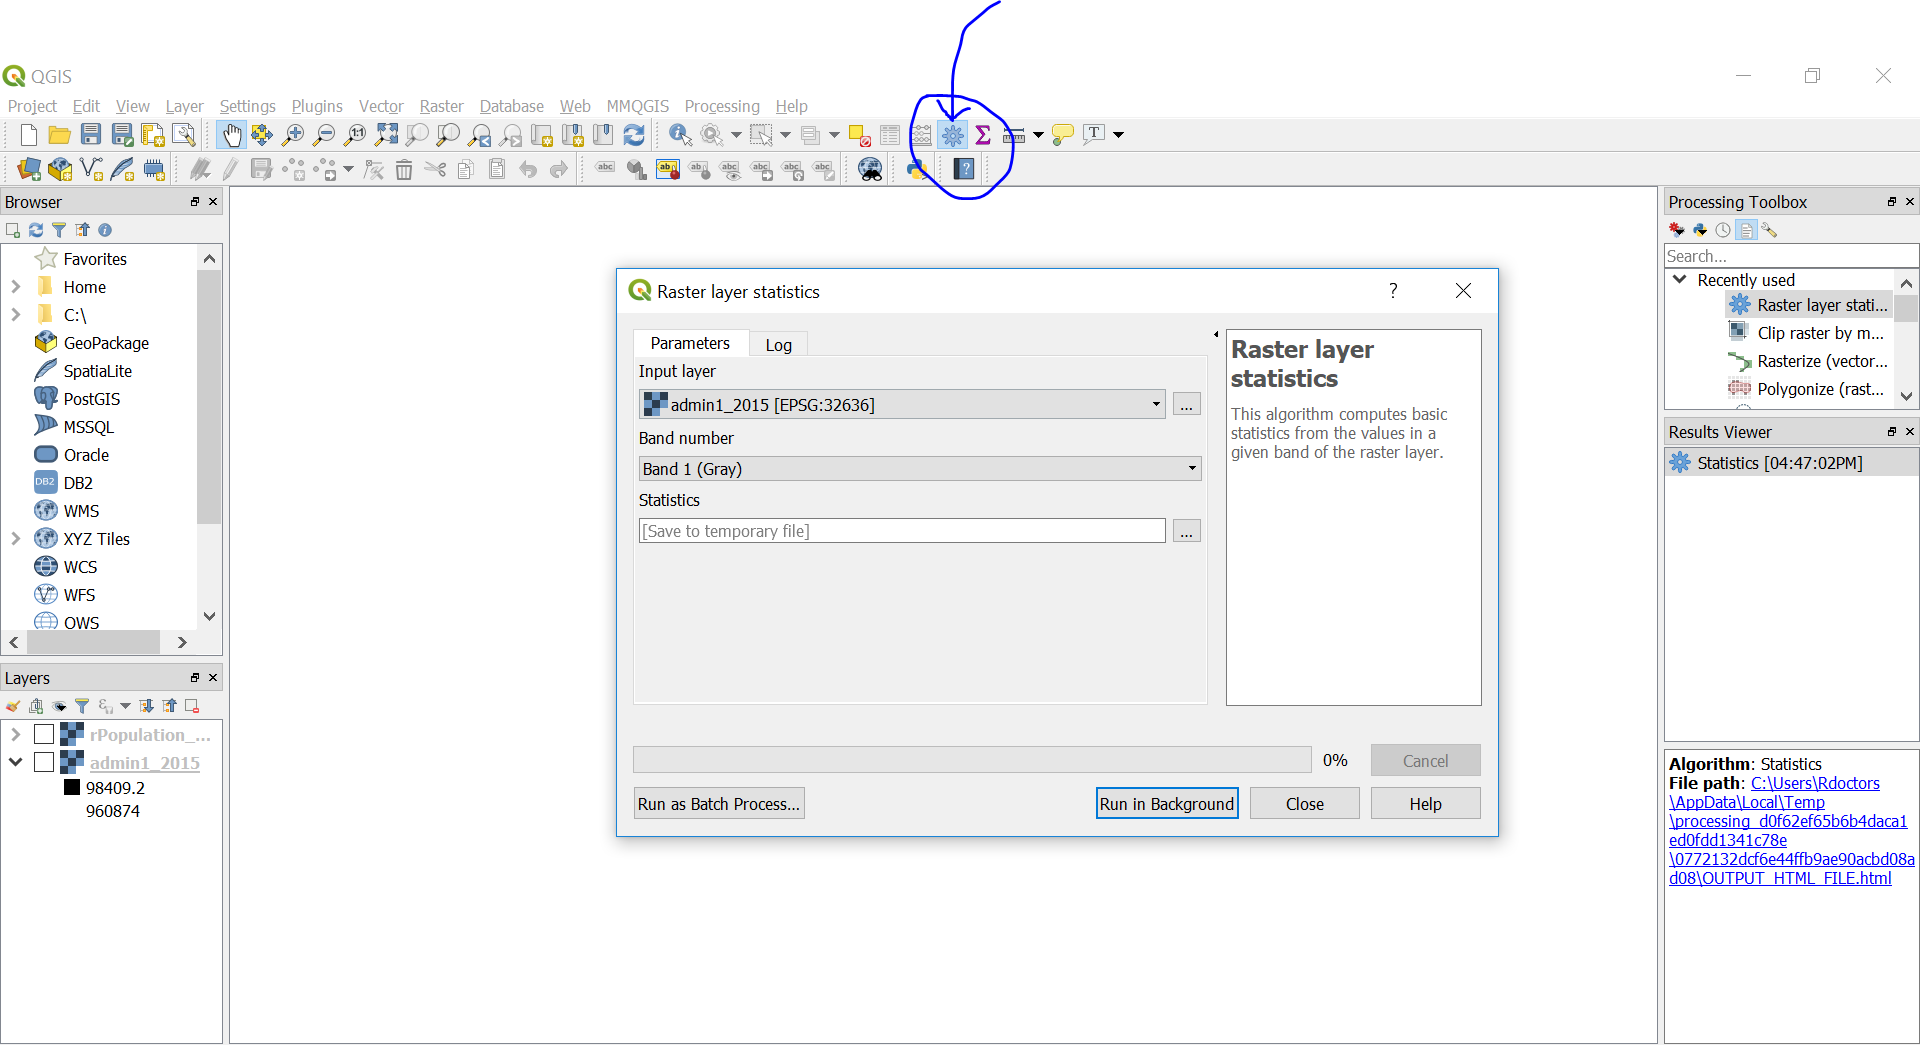
In QGIS, I do:

enter image description here

However, when I use the arcpy.Statistics_analysis from ArcGIS (as follows), I get a different result. The later actually seems to give a more accurate result than the one that I found with R and QGIS, but I wanted to understand why these results are different. Why isn't the total sum equal when using the same data?

import arcpy 
arcpy.env.workspace = "path_where_gdb_is"
arcpy.Statistics_analysis("GPW_ac_ad1_15","output_path",[["SUM_E_ATOT","SUM"]])    
4
  • 1
    Well, without a reproducible example we can only speculate, or make up answers. This should be something that you can quantify on your own by retrieving a small example of actual values and calculating by hand. I can say though, in my experience, ESRI has had numerous problems with these types of operators (many reported bugs). That said, please be mindful of the functions you use. The R raster::cellStats function, by default, uses a sampling approach. If you use asSample=FALSE in the function you will get a different answer that represents the population sum. I can't speak to QGIS though. Commented May 3, 2018 at 16:28
  • 1
    Since you need a population sum, in R, you could just use: sum(my_raster[!is.na(my_raster)]) Commented May 3, 2018 at 16:30
  • Hello Jeffrey, thank you for your reply. I tried using the sum(my_raster[!is.na(my_raster)]) command you gave to me, but the result is the same as using the cellStats function, which in my understanding is giving an overestimated result (I'm working with the southern region of Malawi and I'm finding a total population of 12 billion people (!!) when using R or QGIS, whereas I find a total population of 7.6 million when using ArcGIS, which seems to be more reasonable). I'll edit my comment to add an example.
    – rebeca
    Commented May 3, 2018 at 18:14
  • So, in R the call 'r[!is.na(r)]' returns a vector of the actual values in the raster sans nodata values. If you operate on this vector you are operating on the individual values in the raster. There is absolutely nothing fancy going on here. If you post your data (even a subset) up somewhere, this can clearly be demonstrated. Commented May 3, 2018 at 19:43

2 Answers 2

8

**** Edit, this is an example of why procedural details and a reproducible example are important. It looks like your data was summarized to zones. In R, and plausibly QGIS, you are attempting to sum each pixel and not take the sum of the zones. In R if I use sum(unique(my_raster[!is.na(my_raster)])) I get 7,647,114 however if I just sum the entire raster the result is 12,010,503,977. The use of unique collapses the values to a single value per zone thus, yielding the correct sum. ****

Functionally, a raster is nothing more than a matrix or array (stack of matrices). In R the raster package provides special object classes for rasters along with functions but, you can still treat it as a matrix/array object. Since you can treat a raster as a matrix or vector object (through coercion), it is quite easy to retrieve the full values of a given raster in ways independent of cellStats as to test results. Here we can directly observe the behavior and consistency of derived statistics around raster objects.

Let's add the raster library, create a matrix (rmat) and an associated raster (r) to work with.

library(raster)

( rmat <- matrix(round(runif(100, 0,1500),0), nrow=10, ncol=10) )
( r <- raster(rmat) )
  plot(r)

Now, we can sum the matrix as well as the raster. Since the raster is not large (resulting in it being in memory), the function will decide to not use a sampling approach so, the results should be exact.

sum(rmat)
cellStats(r, sum)

We can also collapse the entire raster into a vector and return the sum;

r[]
sum(r[])

and directly compare it to the original matrix by doing the same (unnecessarily because we just sum the matrix directly).

as.vector(rmat)
sum(as.vector(rmat))

Directly observing the functional behavior of objects gives a clearer understanding of what is going on behind the scenes here. Since it is possible to coerce the data (eg., r[]) into a simple object, such as a vector or matrix, you can have confidence in the results and easily track down issues when they arise.

5

Don't use zonal statistics as a table in ArcGIS suggests that there may be a bug or bugs in the results from ArcGIS zonal stats.

The author of that blog post later added:

Update March 18 2018: make sure you check out the comments from Steve Kopp (spatial analyst development team) below and the discussion - it is interesting.

Those comments by Steve start:

We were able to reproduce your example and understand how you got that answer. However, we are also able to get the correct answer by following the recommendation in the documentation. There is not a bug in the algorithm, it uses the method described in the documentation.

1
  • I've edited your answer to alert readers that they should probably read both the blog post and comments on it before uncritically accepting the original assertion that any bug(s) in that tool have been acknowledged. This is not my area of expertise so I cannot say definitively one way or the other but I hope you, like me, will want readers of your answer to follow the link to view the perspectives of both one tool user and one of the tool's developers.
    – PolyGeo
    Commented Jul 22, 2018 at 8:43

Your Answer

By clicking “Post Your Answer”, you agree to our terms of service and acknowledge you have read our privacy policy.

Not the answer you're looking for? Browse other questions tagged or ask your own question.