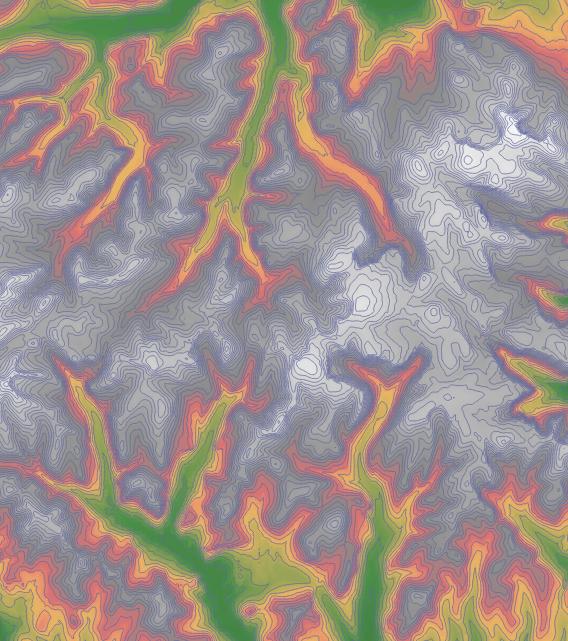
I have a full set of the old half-Inch Scale John Bartholomew maps produced up to the early 1970s (1972 - 1974) of Great Britain, and I'd like to produce new mapping in the same style, but with modern Sans Serif settlement labels and fully up-to-date roads using Ordnance Survey free Open Esri Shape Data.
In particular, I want to make the map with the Contour Lines and Stepped Hypsometric Tints that John Bartholomew used - Bartholomew used non-uniform contour interval that varied with the height above sea level.
Is it possible to make Custom Contours with variable intervals in feet from DEM or other Elevation Data, or is QGIS restricted to one Contour Interval in metric units only?
The reason for this is a personal subjective one - I feel that elevation in feet gives a better 'feel' of the relatively modest range of elevation in the British Isles than contours in metres do.
If QGIS can't do it, is there another mapping application that can?

