1

I have a shapefile of US counties downloaded from the Census, a set of points, and a calculated radius around each point. I'm trying to draw a circle of that radius around each point, then plot the overlap and do various calculations on that overlap.

The calculations come later, but right now, when I run the following code, I get an error. Here is a reproducible example:

library(sf)
library(tidyverse)
library(USAboundaries)

albers_epsg <- 42303 # 102003

# download county boundaries
counties <- us_counties(map_date = "2000-01-01", resolution = "high", 
                        states = c("Utah", "New Mexico", "Colorado", "Arizona"))
st_crs(counties)
plot(st_geometry(counties))
counties <- counties %>% st_transform(albers_epsg)

# initialize point and project latitude and longitude to a coordinate system
# that prioritizes accurate distances
lon <- -111.101099
lat <- 40.477140
elev <- 150
tower <- st_point(x = c(lon, lat, elev), dim = "XYZ")
tower <- tower %>% st_sfc(crs = st_crs(counties)$epsg) %>% st_transform(albers_epsg)


# draw the radio horizon around the tower
scalar <- 3.57
radius <- scalar * sqrt(tower[[1]][3]) * 1000
tower_buffer <- st_buffer(tower, dist = radius)

plot(st_geometry(st_intersection(counties, tower_buffer)))

I understand that I have to project the latitude/longitude points from EPSG 4326 (which is how the shapefiles come from the Census) into a form that can measure distance. I care about accurate distance most of all, so I chose the Albers, which is EPSG 102003 or EPSG 42303.

When I run the code above, however, I get this error:

Error in CPL_transform(x, crs$proj4string) : OGR error
In addition: Warning message:
In CPL_crs_from_epsg(as.integer(x)) :
  GDAL Error 6: EPSG PCS/GCS code 42303 not found in EPSG support files.  Is this a valid
EPSG coordinate system?

The error is the same if I use EPSG 102003 instead. Does R not support these projections? I'm using R 3.5.1 that I built from source on a Debian 9 machine.

5
  • you could transform to UTM Commented Aug 21, 2018 at 21:54
  • @sebdalgarno I added a reproducible example and did a little more research on what I think are suitable projections to use, but I'm still getting errors. Can you give me a little more detail on your tip? I'm not sure how to apply it to my code at the moment.
    – Michael A
    Commented Aug 22, 2018 at 18:50
  • try the proj4string for 102003. "+proj=aea +lat_1=29.5 +lat_2=45.5 +lat_0=37.5 +lon_0=-96 +x_0=0 +y_0=0 +datum=NAD83 +units=m +no_defs" Commented Aug 22, 2018 at 19:17
  • @sebdalgarno Well, that projection string works, in the sense that with a few tweaks, the code runs without errors, but even though those coordinates are right in the middle of Utah, when both shapefiles are plotted on the same plot, they don't overlap. Hmmm
    – Michael A
    Commented Aug 23, 2018 at 14:06
  • @sebdalgarno Thank you for the information. With some tweaking and the advice I received from you and the comments on this question, I got it to work. I summarized everything in an answer in case other people run across this too.
    – Michael A
    Commented Aug 23, 2018 at 18:40

1 Answer 1

0

Per sebdalgarno's comment and the advice in this comment/answer, I set the input projection to be consistent across both files, i.e. "+proj=longlat +datum=WGS84 +no_defs", and then projected/transformed the tower location to the Albers projection.

library(sf)
library(tidyverse)
library(USAboundaries)

albers_proj <- "+proj=aea +lat_1=29.5 +lat_2=45.5 +lat_0=37.5 +lon_0=-96 +x_0=0 +y_0=0 +datum=NAD83 +units=m +no_defs"

# download county boundaries
counties <- us_counties(map_date = "2000-01-01", resolution = "high", 
                        states = c("UT", "NM", "CO", "AZ"))
input_proj <- st_crs(counties)$proj4string
plot(st_geometry(counties))
counties <- counties %>% st_transform(albers_proj)

lon <- -111.101099
lat <- 40.477140
elev <- 150
tower <- st_point(x = c(lon, lat, elev), dim = "XYZ")
tower <- tower %>% st_sfc(crs = input_proj) %>% st_transform(crs=albers_proj)

# draw the radio horizon around the tower
scalar <- 3.57
radius <- scalar * sqrt(tower[[1]][3]) * 1000
tower_buffer <- st_buffer(tower, dist = radius)

# transform back into the input projection for nice plotting
counties <- counties %>% st_transform(crs=input_proj)
tower_buffer <- tower_buffer %>% st_transform(crs=input_proj)

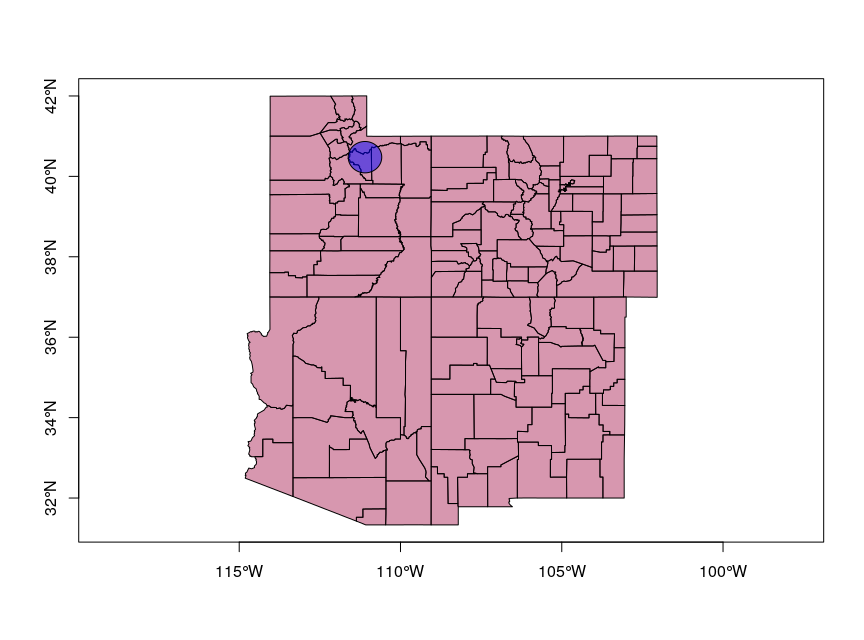
plot(st_geometry(counties), col = adjustcolor("maroon", alpha=0.5), axes=TRUE)
plot(st_geometry(tower_buffer), col = adjustcolor("blue", alpha=0.5), add=TRUE)

The final map (from this code, at least) looks like this:

![corrected map

Your Answer

By clicking “Post Your Answer”, you agree to our terms of service and acknowledge you have read our privacy policy.

Not the answer you're looking for? Browse other questions tagged or ask your own question.