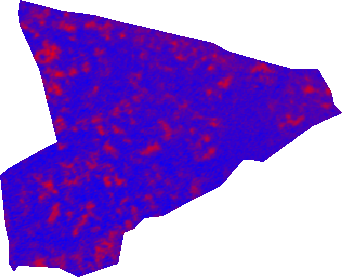
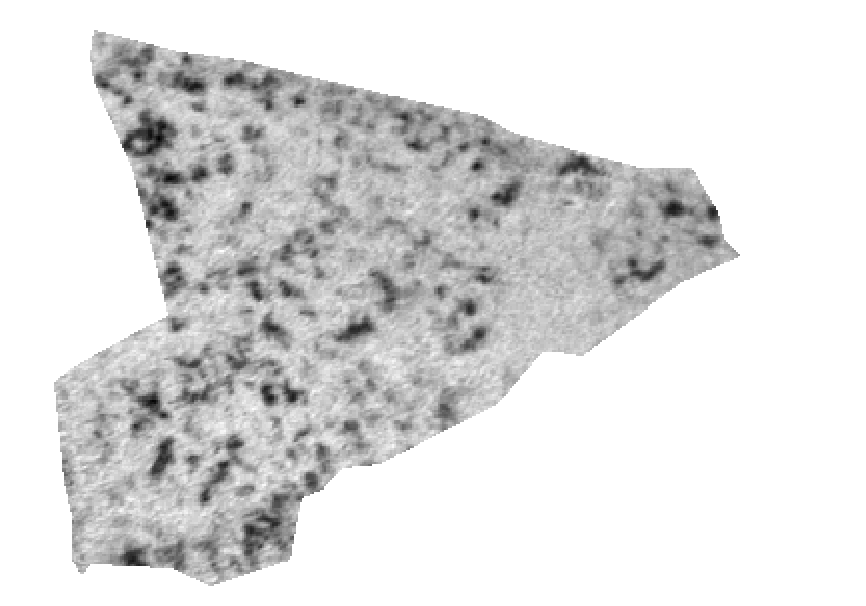
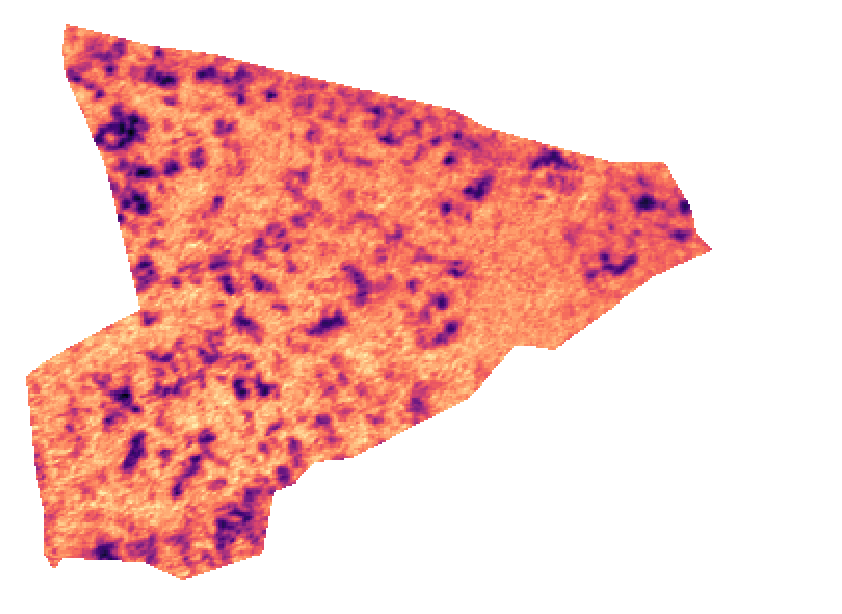
While you could probably do this by rolling a set of nested loops to go over the individual pixels and hand calculate the RGB values you want to stuff into the image and save it out as a PNG, it is easier to stuff the coverage into a MapContent, adding a Style with a ColorMap and then ask the renderer to draw it to an empty image.
package spike;

import java.awt.Graphics2D;
import java.awt.image.BufferedImage;
import java.io.File;
import java.io.IOException;

import javax.imageio.ImageIO;

import org.geotools.coverage.grid.GridCoverage2D;
import org.geotools.coverage.grid.io.AbstractGridCoverage2DReader;
import org.geotools.coverage.grid.io.AbstractGridFormat;
import org.geotools.coverage.grid.io.GridFormatFinder;
import org.geotools.factory.CommonFactoryFinder;
import org.geotools.factory.Hints;
import org.geotools.gce.geotiff.GeoTiffFormat;
import org.geotools.map.GridCoverageLayer;
import org.geotools.map.Layer;
import org.geotools.map.MapContent;
import org.geotools.renderer.GTRenderer;
import org.geotools.renderer.lite.StreamingRenderer;
import org.geotools.styling.ColorMap;
import org.geotools.styling.ColorMapEntry;
import org.geotools.styling.RasterSymbolizer;
import org.geotools.styling.SLD;
import org.geotools.styling.Style;
import org.geotools.styling.StyleFactory;
import org.opengis.filter.FilterFactory2;

public class TiffToPng {

  public static void main(String[] args) throws IllegalArgumentException, IOException {
    // TODO Auto-generated method stub
    File input = new File(args[0]);
    TiffToPng.convert(input);

  }

  private static void convert(File input) throws IllegalArgumentException, IOException {
    AbstractGridFormat format = GridFormatFinder.findFormat(input);
    // working around a bug/quirk in geotiff loading via format.getReader which
    // doesn't set this correctly
    Hints hints = null;
    if (format instanceof GeoTiffFormat) {
      hints = new Hints(Hints.FORCE_LONGITUDE_FIRST_AXIS_ORDER, Boolean.TRUE);
    }

    AbstractGridCoverage2DReader reader = format.getReader(input, hints);
    GridCoverage2D grid = reader.read(null);
    reader.dispose();

    BufferedImage image = new BufferedImage(grid.getGridGeometry().getGridRange2D().width,
        grid.getGridGeometry().getGridRange2D().height, BufferedImage.TYPE_4BYTE_ABGR);

    MapContent mapContent = new MapContent();
    mapContent.getViewport().setCoordinateReferenceSystem(grid.getCoordinateReferenceSystem());
    Layer rasterLayer = new GridCoverageLayer(grid, createStyle(1,-0.4,0.2));
    mapContent.addLayer(rasterLayer);
    GTRenderer draw = new StreamingRenderer();
    draw.setMapContent(mapContent);
    Graphics2D graphics = image.createGraphics();
    draw.paint(graphics, grid.getGridGeometry().getGridRange2D(), mapContent.getMaxBounds());
    File out = new File("test.png");
    ImageIO.write(image, "PNG", out);

  }

  private static Style createStyle(int band, double min, double max) {

    FilterFactory2 ff = CommonFactoryFinder.getFilterFactory2();
    StyleFactory sf = CommonFactoryFinder.getStyleFactory();

    RasterSymbolizer sym = sf.getDefaultRasterSymbolizer();
    ColorMap cMap = sf.createColorMap();
    ColorMapEntry start = sf.createColorMapEntry();
    start.setColor(ff.literal("#ff0000"));
    start.setQuantity(ff.literal(min));
    ColorMapEntry end = sf.createColorMapEntry();
    end.setColor(ff.literal("#0000ff"));
    end.setQuantity(ff.literal(max));

    cMap.addColorMapEntry(start);
    cMap.addColorMapEntry(end);
    sym.setColorMap(cMap);
    Style style = SLD.wrapSymbolizers(sym);

    return style;
  }
}
With a bit more effort I could probably work out how to write the image back out as a PNG+WLD file but it isn't clear if that is what you need. Anyway this is what the result looks like:

EDIT
For anyone who does want a world file etc to go with the output png here is the code:
File out2 = new File("test2.png");
final WorldImageWriter wiWriter = new WorldImageWriter(out2);

// writing parameters for png
final Format writerFormat = wiWriter.getFormat();

// setting write parameters
final ParameterValueGroup params = writerFormat.getWriteParameters();
params.parameter(WorldImageFormat.FORMAT.getName().toString()).setValue("png");
final GeneralParameterValue[] gpv = {
    params.parameter(WorldImageFormat.FORMAT.getName().toString())
};
GridCoverageFactory factory = CoverageFactoryFinder.getGridCoverageFactory(null);
GridCoverage2D coverage = factory.create("name", image, grid.getEnvelope());
// writing
wiWriter.write(coverage , gpv);
wiWriter.dispose();
//write out the prj file too
File prj = new File("test2.prj");
PrintWriter pw = new PrintWriter(prj);
pw.print(coverage.getCoordinateReferenceSystem().toWKT());
pw.close();


