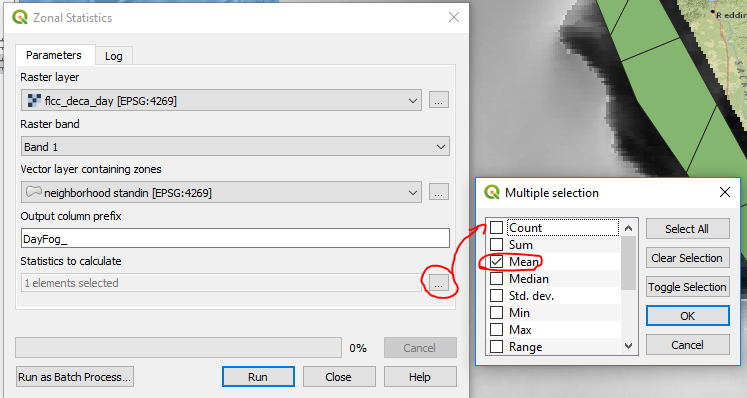
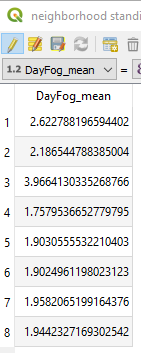
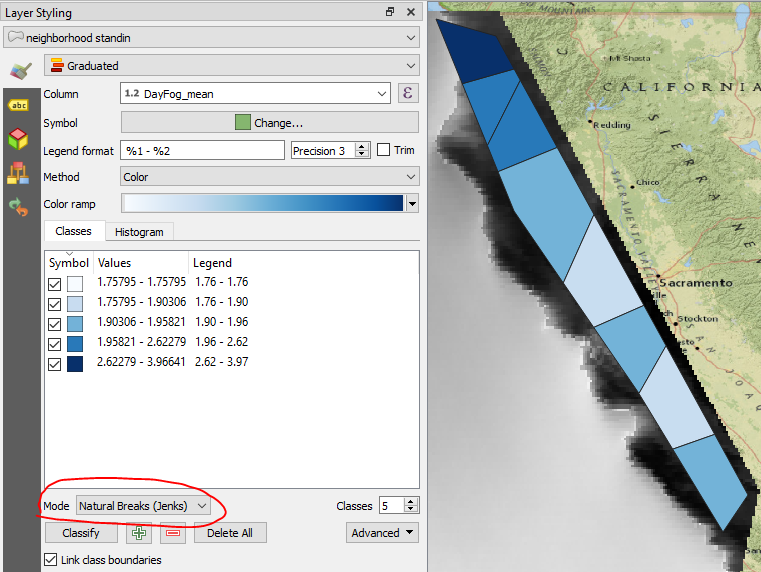
I'd like to make a map that shows the amount of fog by San Francisco neighborhood.
I'm using QGIS. I have some of the pieces:
- a geoJSON file for each of the neighborhoods.
- a raster map with a shapefile for the fog belt zones
- a vector file for the contours generated by the fog belts
- a map that shows the average number of hours for the Bay Area
My goal would be something like this, where each neighborhood has one value for the average summertime hours of fog & low clouds per day in that neighborhood -
https://i.sstatic.net/tKL2x.jpg
I'm not sure how to read the raster map of fog belt zones. My understanding is that the area between each of the contours indicates how much fog is expected in that geographic space.
It's unclear to me how to turn that into something more readily understandable, like the map I linked above.
How do I translate the fog belt zones file into expected fog in geographic space?


