I am trying to plot an hdf5 file where geographical domain is defined like : group
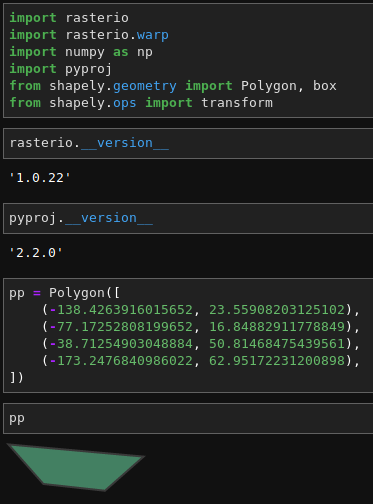
     LL_lat :       23.55908203125102
     LL_lon :       -138.4263916015652
     LR_lat :       16.84882911778849
     LR_lon :       -77.17252808199652
     UL_lat :       62.95172231200898
     UL_lon :       -173.2476840986022
     UR_lat :       50.81468475439561
     UR_lon :       -38.71254903048884
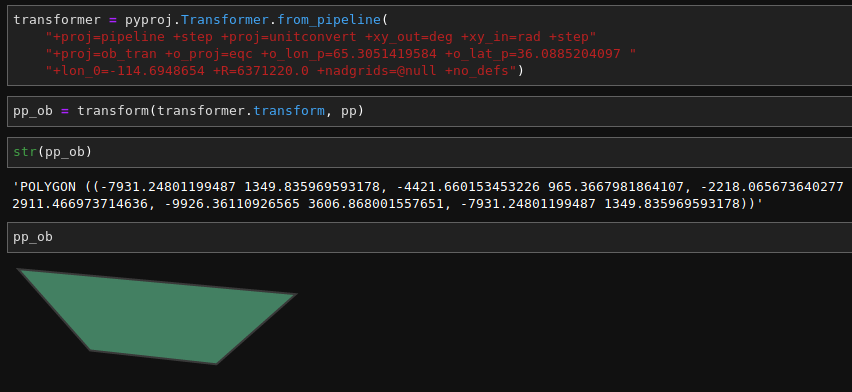
     projdef :      +proj=ob_tran +o_proj=eqc +o_lon_p=65.3051419584 +o_lat_p=36.0885204097 +lon_0=-114.6948654 +R=6371220.0 +nadgrids=@null +no_defs
     xscale :       2501
     xsize :        2882
     yscale :       2500.7
     ysize :        2032
I used this python part code:
p= Proj("+proj=ob_tran +o_proj=eqc +o_lon_p=65.3051419584 +o_lat_p=36.0885204097 +lon_0=-114.6948654 +R=6371220.0 +nadgrids=@null +no_defs")
x = np.arange(1,2883,1)*2885
y = np.arange(1,2033,1)*2500.7
xxx,yyy = np.meshgrid(x,y)
lon_prj, lat_prj = p(xxx, yyy, inverse=True)
but without any success. and when i display min/max lat/lon i got these values :
lon : 19.765991830501918 89.99395869502186
lat : -179.9999851526395 179.99996665510375


