I am building a tool to calculate navigation charges for aircraft flying within Europe. This function is administered by an organisation called EUROCONTROL.
EUROCONTROL have an application of their own (I have my reasons for wanting to recreate the functionality). Within that application is a file containing some sort of geo file in .txt format with the boundaries for the various zones.
The UK extract is below as an example, EG being the identifier for the UK.
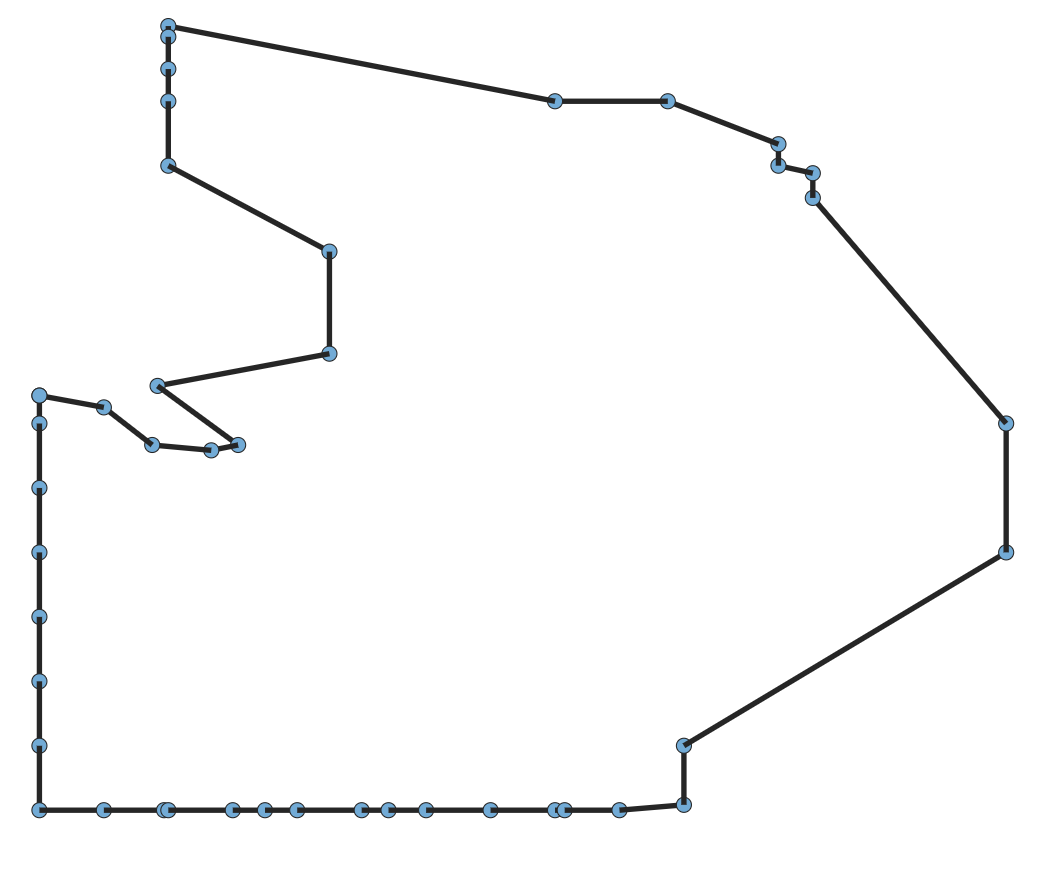
Assuming I'm looking at what I think I'm looking at, its a closed polygon.
Is anyone able to identify the format, and even better, explain it?
44 3259 -198 1 0 660 0 0 0 0 0 0 0 0 EG
3274 -600
3300 -600
3360 -600
3420 -600
3480 -600
3540 -600
3600 -600
3660 -600
3660 -540
3660 -484
3660 -480
3660 -420
3660 -390
3660 -360
3660 -300
3660 -275
3660 -240
3660 -180
3660 -120
3660 -111
3660 -60
3655 0
3600 0
3420 300
3300 300
3090 120
3067 120
3060 88
3040 88
3000 -15
3000 -120
2930 -480
2940 -480
2970 -480
3000 -480
3060 -480
3140 -330
3235 -330
3265 -490
3320 -415
3325 -440
3320 -495
3285 -540
3274 -600
Edit
I used Pythons svgwrite to draw the number pairs as coordinates and got the below. I'm trying to find something that matches it.
