This is how I do it using QGIS - Geopandas - sklearn.svm.SVC. I have a Sentinel 2 satellite image which I want to classify into:
- Agricultural
- Clearcut forest
- Forest
- Mire
- Road
- Water
Create truth data in QGIS
- Create a line layer, add the field Classtxt (string) and Classid (integer)
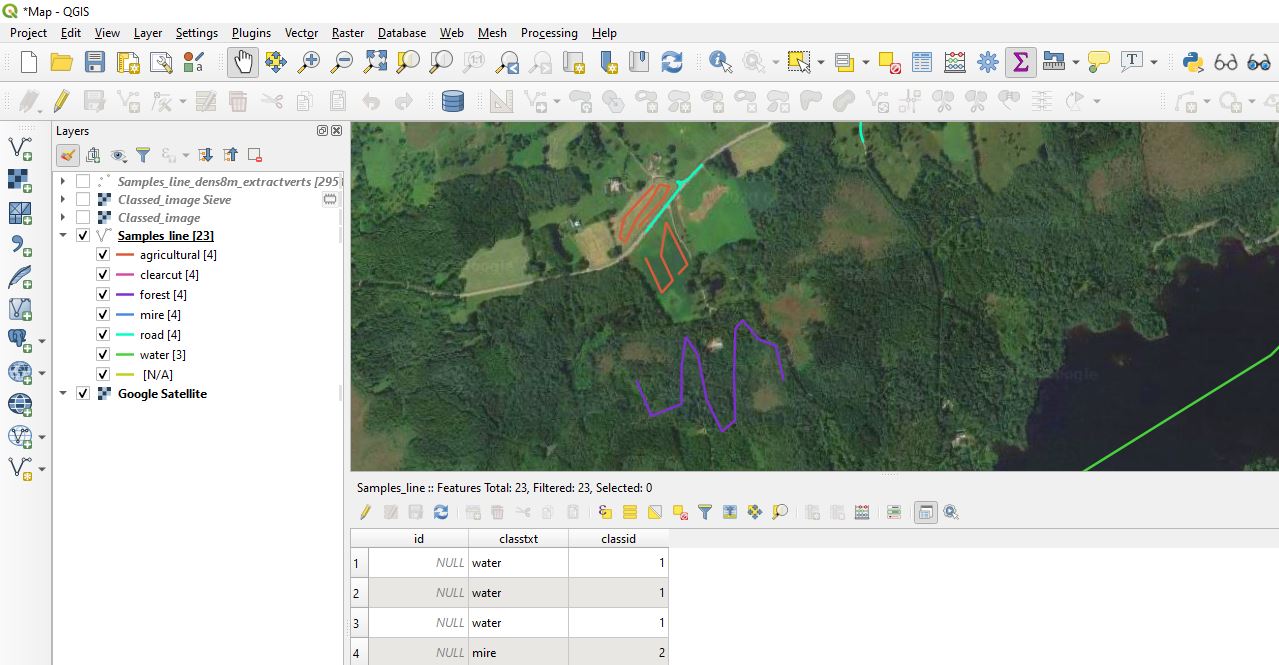
- Draw lines for each class, for example a line which is all inside forest. I assume the more you draw the better the classification will be. I drew a total of 22 km lines for this test:

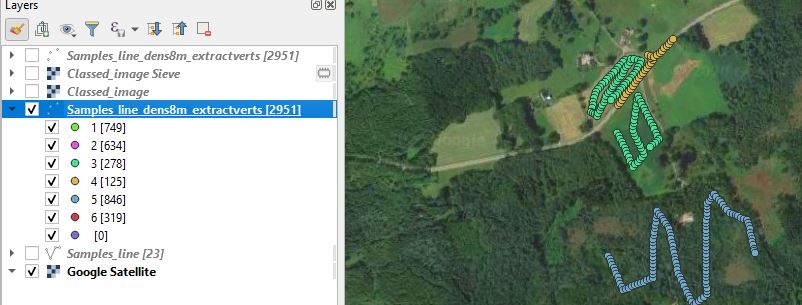
- Densify by Interval. I used 8m to create one vertex each 8 m
- Extract vertices to get a point layer with many points per class. I should have drawn more road lines (classid 4)...

Read the data into geopandas, zonal stats each point, train model, classify each Sentinel2 pixel
Commented code:
from sklearn.svm import LinearSVC
from sklearn.pipeline import make_pipeline
from sklearn.preprocessing import StandardScaler
import geopandas as gpd
import pandas as pd
from rasterstats import zonal_stats
import os
import numpy as np
import rasterio

pointfile = 'C:\GIS\Machine_learning\Landuse\Samples_line_dens8m_extractverts.shp'
s2folder = r'C:\GIS\Machine_learning\Landuse\S2_geotiff' #I had to convert the *.jp2 to *.tif because my rasterstats is broken and cant read jp2

df = gpd.read_file(pointfile) #Create geodataframe from the points
#Calulate statistic(s) for each point
for root, folders, files in os.walk(s2folder):
    for file in files:
        f = os.path.join(root, file)
        if os.path.isfile(f) and f.endswith('.tif'): #I use blue, green, red and infrared bands
            print(file)
            stats = ['max'] #Since we are using point files there's no reason for 'mean', 'median' 'std' etc...
            df2 = pd.DataFrame(zonal_stats(vectors=df['geometry'], raster=f, stats=stats))
            df2.columns=['{0}_{1}'.format(stat, file.split('.')[0]) for stat in stats]
            df = df.join(df2)

#We now have:
#df.columns.tolist()
#['classtxt', 'classid', 'geometry', 'max_B02', 'max_B03', 'max_B04', 'max_B08'] #I deleted the many fields created in the QGIS processing..

#Split data into train and test (https://stackoverflow.com/questions/24147278/how-do-i-create-test-and-train-samples-from-one-dataframe-with-pandas)
msk = np.random.rand(len(df)) < 0.8
train = df[msk]
test = df[~msk]

#Train the model
predictor_cols = ['max_B02', 'max_B03', 'max_B04', 'max_B08']
X = train[predictor_cols].values.tolist() #List of lists: [64.0, 33.0, 41.0, 43.0] #X are the stats/predictor data
y = train['classid'].tolist() #y[:5]: [1, 1, 1, 1, 1] #y are the classes

clf = make_pipeline(StandardScaler(),
                    LinearSVC(random_state=0, tol=1e-3)) #I have no idea what parameters to use, just copied from some example  :)
clf.fit(X, y)

#Test
Xtest = test[predictor_cols]
ytest = test['classid']
p = clf.predict(Xtest)
clf.score(Xtest,ytest) #81% accuracy

#Class entire raster using the model. I read the rasters into numpy arrays and reshape to a 2d array of four columns (B02, B03, B04, B08) and many rows
#Im sure this could be done with less code..

b2 = rasterio.open(os.path.join(s2folder, 'B02.tif')).read()
b2 = b2[0,:,:] #Drop the first dimension that is created when using rasterio open
b3 = rasterio.open(os.path.join(s2folder, 'B03.tif')).read()
b3 = b3[0,:,:]
b4 = rasterio.open(os.path.join(s2folder, 'B04.tif')).read()
b4 = b4[0,:,:]
b8 = rasterio.open(os.path.join(s2folder, 'B08.tif')).read()
b8 = b8[0,:,:]
bands = np.dstack((b2,b3,b4,b8))
bands = bands.reshape(int(np.prod(bands.shape)/4),4)

r = clf.predict(bands) #Predict using the model and Sentinel2 bands
r = r.reshape(b2.shape) #Reshape into a 2d array

#Write the r (result) array to a georeferenced image
b2src = rasterio.open(os.path.join(s2folder, 'B02.tif'))
with rasterio.Env():
    profile = b2src.profile
    profile.update(
        dtype=rasterio.uint8,
        count=1,
        compress='lzw')
    with rasterio.open('C:\GIS\Machine_learning\Landuse\Classed_image.tif', 'w', **profile) as dst:
        dst.write(r.astype(rasterio.uint8), 1)
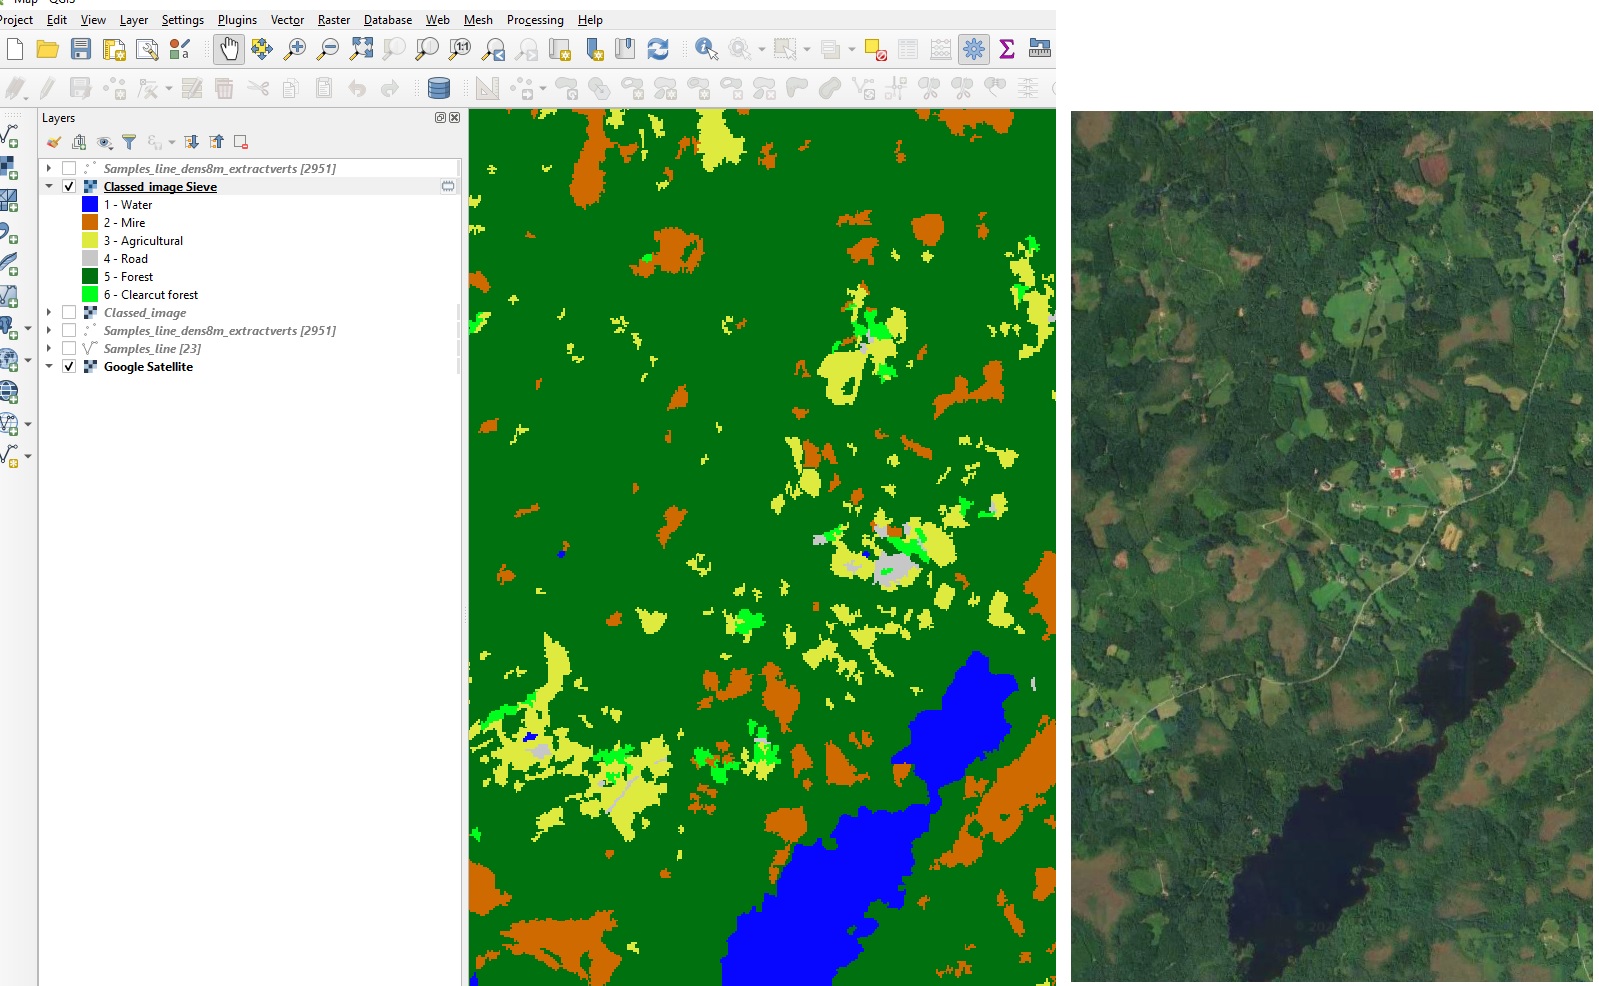
The output was pretty noisy so I gdal.sieved away pixel clusters using THRESHOLD=10. It did not classify clearcuts and roads as good as the other classes. Maybe because many roads are narrower than the Sentinel 2 10 m pixel size.


roi.shapeandimg.shapevalues?