10

I'm using the cdsapi python package to download ERA5 data in netcdf format. I'd like to plot it alongside data from a GPS track and so I'm trying to ensure that the coordinate reference systems (CRS) of both datasets are the same. Ideally, I'd like to convert the ERA5 data to WGS84.

When I open the ERA5 netcdf data with xarray, no CRS is recognized. I've found the spatial reference/earth model used in ERA5 is a sphere with radius 6367.47 km (assuming netcdf inherits from GRIB1 instead of GRIB2), but I can't find a name for this (incomplete?) CRS and don't understand how to use this information to convert the ERA5 data to WGS84.

The comment on this question suggests that I can just convert the longitude values of my ERA5 data to values between -180 and 180, set the CRS to WGS84, and be done with it. But this doesn't seem right, because the WGS84 uses an ellipsoid rather than a sphere to derive the coordinates of physical locations. How can I best convert the ERA5 data to WGS84? I'm interested in both the relevant theory and its practical application (preferably in python).

Here's a minimum working example of my current approach. First I download data using the following code.

import cdsapi
client = cdsapi.Client()
client.retrieve(
    'reanalysis-era5-single-levels', {
        'product_type': 'reanalysis',
        'variable':     '2m_temperature',
        'year':         '2017',
        'month':        '12',
        'day':          '17',
        'time':         '00:00',
        'area':         [90, 0, 0, 360],
        'grid':         [1.0, 1.0],
        'format':       'netcdf'
},
'era5_test.nc')

Then I load the data with xarray and convert it to a GeoDataFrame.

import xarray as xr
import geopandas as gpd
ds = xr.open_dataset('era5_test.nc')
df = ds.to_dataframe().reset_index()
gdf = gpd.GeoDataFrame(df, geometry = gpd.points_from_xy(df['longitude'],
                                                         df['latitude']))

Then I transform the longitude values and set the CRS to WGS84.

import numpy as np

def transform_era5_lon_to_wgs84_lon(lon):
    return np.mod(lon + 180, 360) - 360

gdf = gdf.apply(lambda col: col.apply(tranfrom_era5_lon_to_wgs84_lon)
                if col.name == 'longitude' else col)
gdf.crs = {'init': 'epsg:4326'}
1
  • 1
    If you use a PROJ string, parameter +R=radius-in-meters. One way to convert between ellipsoids is to do a transformation like geocentric translation that has its parameters set to zeroes. The math converts the input lat-lon-h to XYZ using the input ellipsoid, then converts back to lat-lon-h using the output ellipsoid. That will change the latitude values and ellipsoid heights.
    – mkennedy
    Commented Nov 23, 2020 at 22:48

4 Answers 4

7

I ended up reaching out to the Copernicus support team and it turns out that ERA5 data is already referenced in the horizontal (lat/lon) with respect to the WGS84 ellipse so there is no need to convert it. They pointed me to this link (link dead, a similar sentence is now here), which includes the following statement:

ECMWF data is referenced in the horizontal with respect to the WGS84 ellipse (which defines the major/minor axes) but in the vertical it is referenced to the Geoid (EGM96).

7
  • Did you find a solution? I am facing the same problem
    – Giacomo
    Commented May 4, 2021 at 5:16
  • Yes, the solution is in this answer. The latitude and longitude coordinates of the ERA5 data are already referenced with respect to the WGS84, so there's no need to convert anything if you're using this reference. Edited my answer to clarify.
    – red
    Commented May 7, 2021 at 5:04
  • But when I try to plot the data on a web mercator map the data looks squashed around the poles. Have you noticed this effect on your data?
    – Giacomo
    Commented May 8, 2021 at 15:39
  • As far as I can tell the data is fine for the latitudes I use it (~0-50N). Have you tried looking at the data in another projection that's better suited for plots around the poles?
    – red
    Commented May 9, 2021 at 17:21
  • I need to plot the data in a web map in Folium and projection needs to be EPSG3857 (pseudo mercator). EPSG3857 uses wgs84 for both ellipsoid and geodetic CRS however the ERA5 data uses wgs84 for ellipsoid while for the vertical uses EGM96. I think the ERA5 data is essentially a compound of 2 different projections, one horizontal and one vertical. If I treat ERA5 as it was all in WGS84 when I transform it in EPSG3857 the pixels will align well horizontally but not vertically. I opened here: gis.stackexchange.com/questions/395603/…
    – Giacomo
    Commented May 10, 2021 at 6:50
4

If you are using a NetCDF file, then your data is in EPSG:4326 geographic coordinates.

To rotate the coordinates: https://github.com/corteva/rioxarray/issues/58

However, if you load in the native grib format, then you would want to build a custom geographic CRS:

https://pyproj4.github.io/pyproj/stable/build_crs.html#geographic-crs

I would recommend using rioxarray to write the CRS to the file: https://corteva.github.io/rioxarray/stable/getting_started/crs_management.html

And to reproject: https://corteva.github.io/rioxarray/stable/examples/reproject.html

6
  • So if all NetCDF files use the WGS84 ellipsoid (implied by EPSG:4326, right?), then I'm confused as to why ERA5's official documentation states that it uses a sphere. Would you mind elaborating on this?
    – red
    Commented Nov 22, 2020 at 15:12
  • It interpolates the data when converting to netCDF: "If you request data in NetCDF format ('format':'netcdf'), interpolation to a regular grid is mandatory, because ECMWF's NetCDF implementation only supports regular grids."
    – snowman2
    Commented Nov 22, 2020 at 16:23
  • I was told EPSG:4326 was what was used in netCDF in the past, but probably wouldn't hurt to very that.
    – snowman2
    Commented Nov 22, 2020 at 16:25
  • It may have been something to use as a close enough CRS. So, I recommend tinkering with it.
    – snowman2
    Commented Nov 22, 2020 at 16:35
  • ArcGIS assumes WGS84 for the CF profile, but only because the CF profile isn't clear on how to define a GeoCRS (datum). The doc states the data may not line up because of it.
    – mkennedy
    Commented Nov 23, 2020 at 22:40
2

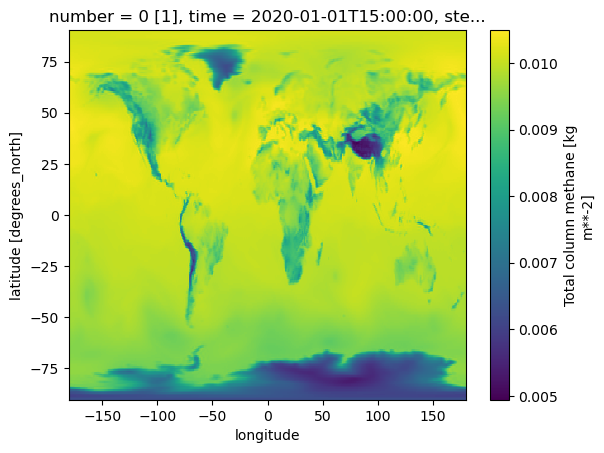
Using Juanma Cintas' solution I found a simpler way of "flipping" the variable in the Xarray dataset was to use the .sortby(coordinate) method after converting the 0-360 longitude to standard -180 - 180.

lonaxis = wd['longitude'].values
newlonaxis = lonaxis[lonaxis >= 180] -= 360

wd['longitude'] = lonaxis

wd.sortby('longitude').sel(time='2020-01-01T15:00:00', method='nearest')['tc_ch4'].plot()

Which yields a coherent data array

Resulting image from sorted data array

1

I've found myself in a similar situation, where I had an ERA5 image centered on the pacific since its coordinates were ranging from 0 to 360. I've based myself on all your comments and links, but I didn't fully get it without flipping the raster values too, not only the longitude coordinates. I will copy here my working solution at the moment in case someone else has the exact same problem:

def fromERA5toWGS84(dataarray, output=None, xaxis = "longitude", name = None):
    import rioxarray
    import xarray as xr
    if type(dataarray) is str:
        if dataarray.split(".")[-1] == "nc":
            dataarray = xr.open_dataset(dataarray, decode_coords="all")
        else:
            dataarray = xr.open_rasterio(dataarray, decode_coords="all")

    else:
        pass
    if type(dataarray) is xr.core.dataset.Dataset:
        if name is None: raise ValueError("I need a variable name")
        dataarray = dataarray[name]

    longitud = dataarray[xaxis].values
    longitud[longitud >= 180] -= 360
    indexes = np.where(longitud >= 0)[0].tolist()
    outindexes = np.where(longitud < 0)[0].tolist()
    array = dataarray.values
    zeros = np.zeros(array.shape)
    zeros[zeros==0] = np.nan
    flipped1 = array[:,:,indexes]
    flipped2 = array[:,:,outindexes]
    zeros[:,:,indexes] = flipped2
    zeros[:,:,outindexes] = flipped1
    longitud.sort()
    dataarray[xaxis] = longitud
    dataarray.values = zeros
    dataarray = dataarray.rio.write_crs(4326)
    if output is not None:
        if output.split(".")[-1] == "nc":
            dataarray.to_netcdf(output)
            del dataarray
            return "Done!"
        elif output.split(".")[-1] == "tif":
            dataarray.rio.to_raster(output)
            del dataarray
            return "Done!"
        else:
            raise ValueError("format not implemented")
    return dataarray

Your Answer

By clicking “Post Your Answer”, you agree to our terms of service and acknowledge you have read our privacy policy.

Not the answer you're looking for? Browse other questions tagged or ask your own question.