My question has a similar intention as in this link: Exporting time series of multiple polygons to .csv. format table
However, in my case, following this code, the table output runs for hours and then fails. I am doing this for a school project, extremely new to GEE and could be making silly errors.
I am trying to estimate the water quality of a few water bodies, the geometries of which I have as a table import(myPoly in the code below).
I need to export a time series of the band values from B1 to B5 for each of the polygons in the table(myPoly in the code below).
I am successfully able to export a .csv for one polygon using the code below.
var feature_geometry = /* color: #d63000 */ee.Geometry.Polygon(
    [[[152.33970575255924, -27.555041715266274],
      [152.33972512360785, -27.55507189866278],
      [152.33974864709506, -27.555092138206774],
      [152.33976838530103, -27.555115340638235],
      [152.33979976776598, -27.55513612225267],
      [152.33982787718892, -27.555160307478587],
      [152.3398568409587, -27.55517391634846],
      [152.33988310356358, -27.555191307533534],
      [152.33991978430754, -27.555203490775874],
      [152.33995439458982, -27.55521975267031],
      [152.33998649311152, -27.555225647588358],
      [152.3400171895999, -27.555235843175478],
      [152.34005624881027, -27.55523845824814],
      [152.34009460494957, -27.555245502351152],
      [152.34010865812022, -27.555246111547888],
      [152.3406839153442, -27.55526396511705],
      [152.34072710914018, -27.55525986938896],
      [152.34077054865222, -27.555260077363187],
      [152.34078446061986, -27.555258213261332],
      [152.34156914104003, -27.55514318437435],
      [152.34199205237897, -27.555181651691527],
      [152.34205553080847, -27.555179438671836],
      [152.34211905665086, -27.55517903323108],
      [152.34212692410586, -27.555176949685123],
      [152.34213512873066, -27.555176663644694],
      [152.34219538347477, -27.55515881950017],
      [152.34225625321793, -27.555142699252606],
      [152.34226315111783, -27.555138750409775],
      [152.34227093907566, -27.555136444037643],
      [152.3423231738059, -27.555104389177178],
      [152.34237654217088, -27.55507383731013],
      [152.34238192143874, -27.555068337501407],
      [152.34238867280254, -27.555064194387068],
      [152.34242872960888, -27.55502048040243],
      [152.34247034845353, -27.554977928868823],
      [152.34247378089967, -27.554971315882597],
      [152.34247895825914, -27.554965665821168],
      [152.3425036486274, -27.554913772372693],
      [152.34253020510485, -27.554862608299867],
      [152.34253141751086, -27.5548554085329],
      [152.34253460875078, -27.554848701272384],
      [152.34254196736606, -27.554792759099758],
      [152.34255134762327, -27.554737055166008],
      [152.34255124628547, -27.554724581552886],
      [152.34253333867068, -27.553970991457973],
      [152.34253003667615, -27.553953146742987],
      [152.3425308622658, -27.553935078312687],
      [152.34251849392135, -27.553890767074545],
      [152.34251015865294, -27.55384572134672],
      [152.34250136615964, -27.553829404530607],
      [152.3424964664893, -27.553811850779955],
      [152.34249101348553, -27.553800351795616],
      [152.3421834185866, -27.553176074209468],
      [152.34215784879848, -27.55313937884634],
      [152.34213615731048, -27.553100770257625],
      [152.3421203870286, -27.553085617172872],
      [152.34210816445676, -27.553068076452668],
      [152.34207205170563, -27.55303917349878],
      [152.34203906014997, -27.55300747306692],
      [152.3420191436484, -27.552996828324574],
      [152.34200188144698, -27.552983012441533],
      [152.3419581003074, -27.552964202552257],
      [152.3419164348113, -27.55294193361053],
      [152.34189395743567, -27.552936644523356],
      [152.34187302967104, -27.552927653211807],
      [152.34182506509669, -27.552920433637816],
      [152.3417780422084, -27.55290936877626],
      [152.34175479314007, -27.552909856350183],
      [152.3417318656466, -27.5529064053112],
      [152.3416835355757, -27.55291135072272],
      [152.34163489827523, -27.55291237069524],
      [152.34162105354284, -27.552914592246776],
      [152.34082280384575, -27.553052836314944],
      [152.34077301008298, -27.55306817713331],
      [152.3407220582692, -27.553080161971984],
      [152.34070564988477, -27.553088929909627],
      [152.34068755312765, -27.55309450527163],
      [152.34064457415167, -27.55312156613553],
      [152.3405994259304, -27.553145691359457],
      [152.34058864505317, -27.55315370641969],
      [152.34020961746353, -27.55344352137888],
      [152.3402052483979, -27.5534479594163],
      [152.34019975004063, -27.553451266584393],
      [152.3401894698145, -27.553459783023747],
      [152.3396187810689, -27.55394586563294],
      [152.33959300712294, -27.553975072646328],
      [152.33956352384521, -27.55400137744232],
      [152.33954910819966, -27.554024818821677],
      [152.33953055173347, -27.55404584695574],
      [152.33951500514502, -27.554080273985168],
      [152.33949498252124, -27.55411283285313],
      [152.33948852574676, -27.554138911041978],
      [152.33947733266777, -27.554163697431107],
      [152.3394732509711, -27.554200604098988],
      [152.33946428282687, -27.55423682536616],
      [152.33946342957898, -27.55424927634419],
      [152.33945000045574, -27.554503386792554],
      [152.33945576354103, -27.554557167077725],
      [152.3394589488181, -27.55461111566492],
      [152.3394625173712, -27.554620192784938],
      [152.33946354284816, -27.554629762372247],
      [152.3394860200278, -27.554679975079274],
      [152.33950607503232, -27.554730987733734],
      [152.33951270635592, -27.554741989322267],
      [152.33968216642427, -27.555013989511846],
      [152.33970575255924, -27.555041715266274]]], null, false),
Sentinel = ee.ImageCollection("COPERNICUS/S2"),

myPoly = ee.FeatureCollection("users/martinomalerba/Poly_Ollivier_Grinham"),


var sentinel2mean = ee.ImageCollection("COPERNICUS/S2")
  .filterBounds(feature_geometry)
  .filter(ee.Filter.lt('CLOUDY_PIXEL_PERCENTAGE',20))
  .filterDate('2017-08-01', '2020-11-11')
  .select('B1', 'B2', 'B3', 'B4', 'B5', 'B6','B7', 'B8')
  .map(function(image){
  var B1_band = image.select('B1');
  var B1_band_mean = B1_band.reduceRegion({
    reducer: ee.Reducer.mean(),
    geometry: feature_geometry,
    scale: 30
    }).get('B1')
    return image.set('B1_mean',B1_band_mean);
}).map(function(image){
  var B2_band = image.select('B2');
  var B2_band_mean = B2_band.reduceRegion({
    reducer: ee.Reducer.mean(),
    geometry: feature_geometry,
    scale: 30
    }).get('B2')
    return image.set('B2_mean',B2_band_mean);
}).map(function(image){
  var B3_band = image.select('B3');
  var B3_band_mean = B3_band.reduceRegion({
    reducer: ee.Reducer.mean(),
    geometry: feature_geometry,
    scale: 30
    }).get('B3')
    return image.set('B3_mean',B3_band_mean);
}).map(function(image){
  var B4_band = image.select('B4');
  var B4_band_mean = B4_band.reduceRegion({
    reducer: ee.Reducer.mean(),
    geometry: feature_geometry,
    scale: 30
    }).get('B4')
    return image.set('B4_mean',B4_band_mean);
}).map(function(image){
  var B5_band = image.select('B5');
  var B5_band_mean = B5_band.reduceRegion({
    reducer: ee.Reducer.mean(),
    geometry: feature_geometry,
    scale: 30
    }).get('B5')
    return image.set('B5_mean',B5_band_mean);
}).map(function(image){
  var waterThreshold = 0;
  //var area = image.pixelArea()
  var ndwi = image.normalizedDifference(['B3', 'B8']).rename('NDWI');
  var water01 = ndwi.gt(waterThreshold);
  image = image.updateMask(water01).addBands(ndwi);
  var area = ee.Image.pixelArea()
  var waterArea = water01.multiply(area).rename('Water_area');
  image = image.addBands(waterArea);
  var stats = waterArea.reduceRegion({
    reducer: ee.Reducer.sum(),
    geometry: feature_geometry,
    scale: 30,
  }).get('Water_area')
  return image.set('Water_area',stats);
});
// Time series at the identified points


var chart2 = ui.Chart.image.seriesByRegion(sentinel2mean, feature_geometry, ee.Reducer.first());
print(chart2, "Sentinel2TimeSeries");
print(sentinel2mean)


Export.table.toDrive({
  collection: sentinel2mean,
  folder: 'GEE',
  description: 'FarmDamMean',
  fileFormat: 'CSV',
  selectors: (['system:index', 'B1_mean', 'B2_mean', 'B3_mean', 'B4_mean', 'B5_mean', 'Water_area'])
});
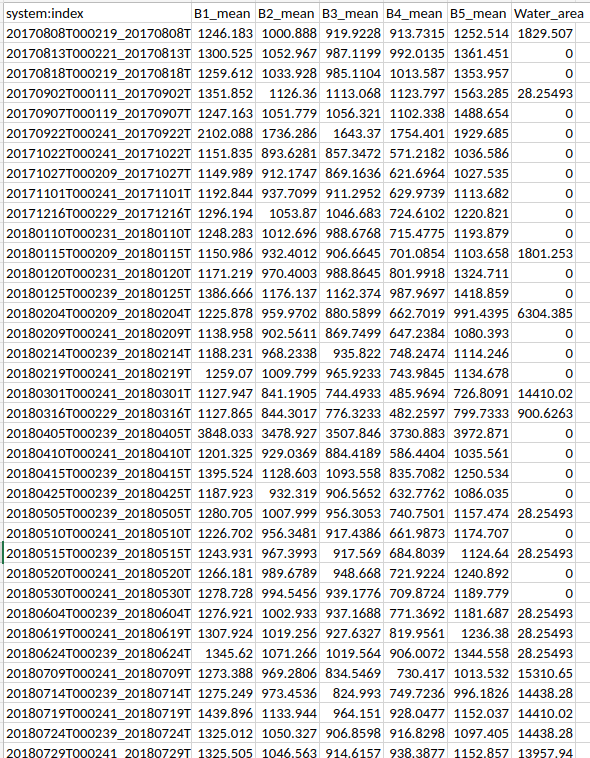
This is the output table I am able to generate:
I need to generate a table with an added column to the left which is the "ID" of the polygon.
This is an example of the table  Any suggestions?

