I'm loading a NetCDF file (ERA5 surface temperatures), then I mask the data using country shapes, and finally generate a plot using geoviews. For the unmasked data everything works as intended. As soon as I clip using rioxarray, half the globe goes missing. In detail:
# Read all relevant data:
data0 = xr.open_dataset("./data/COPERNICUS/adaptor.mars.internal-1621870453.0792851-5880-10-bd60c7b4-8e84-4d2a-acfb-d2cc442d24e1.nc")
sf = geopandas.read_file("./data/NATURAL_EARTH/ne_50m_admin_0_countries.shp")

# Filter and set CRS:
dataslice = data0.load().where((data0.time.dt.strftime("%Y") == "2020") & (data0.expver == 1)
                                  , drop=True).sum("expver").resample({"time": "Y"}).mean()
dataslice.rio.set_spatial_dims(x_dim="longitude", y_dim="latitude", inplace=True)
dataslice.rio.write_crs("EPSG:4326", inplace=True)
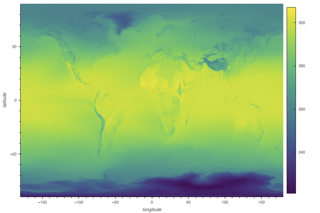
Plotting this with geoviews looks ok:
dataset = gv.Dataset(dataslice, ['longitude', 'latitude', 'time'], 't2m')
images = dataset_clipped.to(gv.Image)
images.opts(cmap='viridis', colorbar=True, width=900, height=600,
            projection=crs.PlateCarree())
Now I want to clip the data using the shapefile and plot the clipped data:
clipped = dataslice.rio.clip(sf.geometry, drop=False)
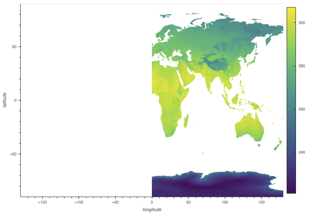
dataset_clipped = gv.Dataset(clipped, ['longitude', 'latitude', 'time'], 't2m')
images_clipped = dataset_clipped.to(gv.Image)
images_clipped.opts(cmap='viridis', colorbar=True, width=900, height=600,
                    projection=crs.PlateCarree())
While the data is clipped by the landmass as intended, all of the Western hemisphere is gone as well.
Remarks:
- This does not depend on the
projectionparameter of geoviews. - Both the gridded data and the shapefile have CRS EPSG:4326.
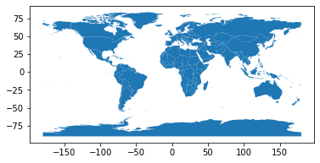
- The Shapefile is complete:
Questions:
- What is going wrong?
- Why do we need to set the CRS anyway? Both the xarray and the geojsons are just tuples (lat,lon,value) and (lat,lon), respectively. Yet
dataslice.rio.clipraises a MissingCRS exception ifdataslice.rio.write_crsis skipped.


