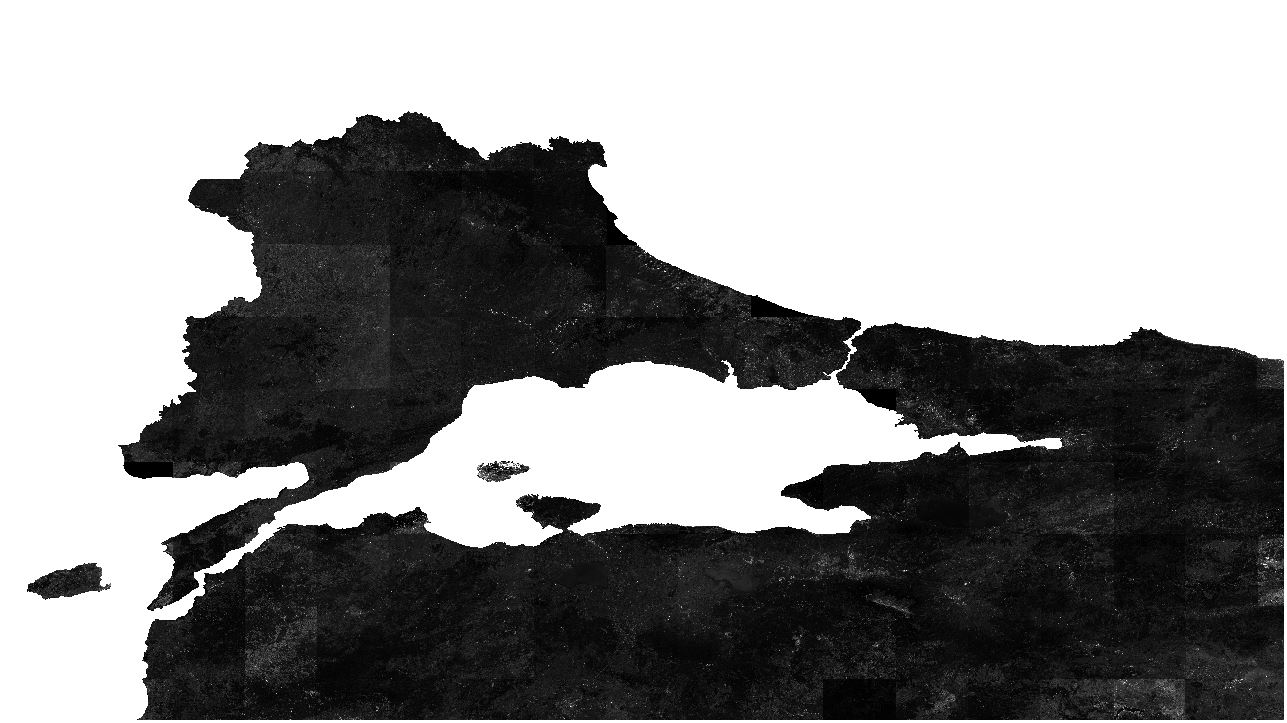
I export to drive an image from Google Earth Engine. Since the image is too large, it is splitted into tiles by GEE. When I visualize each tile in QGIS, I can clearly see the borders of tiles (I am adding a screenshot from QGIS). Reflectance values change between two adjacent pixels at the border.
What can be the reason for that?
var dataset = ee.FeatureCollection("USDOS/LSIB_SIMPLE/2017"),
  modis = ee.ImageCollection("MODIS/006/MOD11A2");
var turkeyBorder = dataset.filter(ee.Filter.eq('country_na', 'Turkey'));

var geometry = ee.Geometry.Polygon((([
  25.664530286665162, 39.5933922181898,
  30.8533440922453, 39.5933922181898,
  30.8533440922453, 42.155646034667264,
  25.664530286665162, 42.155646034667264,
])))

var collection1 = ee.ImageCollection("COPERNICUS/S2_SR")
  .filterBounds(geometry).filterDate("2019-10-01", "2019-11-30")
  .filterMetadata('CLOUDY_PIXEL_PERCENTAGE', 'less_than', 70)

var immedian1 = ee.Image(collection1.median()).clip(turkeyBorder) //.clip(geometry5);
Map.addLayer(immedian1, {
  bands: ['B4', 'B3', 'B2'],
  min: 0,
  max: 2000
}, " immedian1");

var median1_4 = immedian1.select("B4")
Export.image.toDrive({
  image: median1_4,
  description: 'median1_4',
  folder: '2019_istanbul',
  scale: 10,
  fileDimensions: 3328,
  region: geometry,
  maxPixels: 10000000000000,
  skipEmptyTiles: true
});


