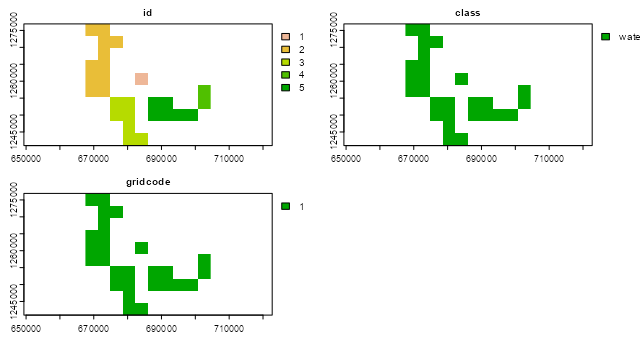
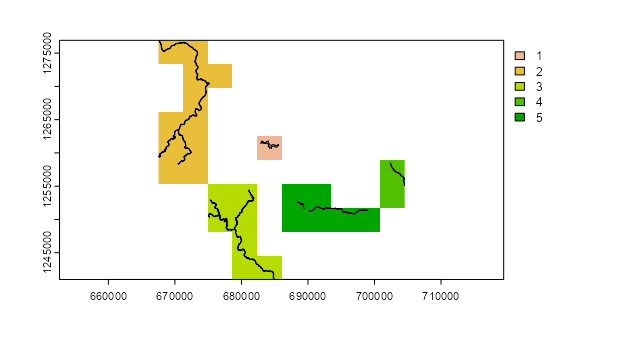
I am currently struggling with rasterizing and later, resampling a vector object using functions from stars and terra.
Let's start with the example dataset here: https://drive.google.com/drive/u/2/folders/1uDVQt1F64rUTfCXclwr-sM-oFjyJ2NwV
This is a dataset of waterbodies and I load them first using sf
waterBodies_nil1870 <- st_read("data\spatial\waterBodies_nil1870.shp")
waterBodies_nil1870 <- st_transform(waterBodies_nil1870, 32643)

> waterBodies_nil1870
Simple feature collection with 5 features and 3 fields
Geometry type: MULTIPOLYGON
Dimension:     XY
Bounding box:  xmin: 667536.9 ymin: 1240976 xmax: 704538.2 ymax: 1276926
Projected CRS: WGS 84 / UTM zone 43N
  id       class gridcode                       geometry
1  1 waterbodies        1 MULTIPOLYGON (((683042.8 12...
2  2 waterbodies        1 MULTIPOLYGON (((669090.5 12...
3  3 waterbodies        1 MULTIPOLYGON (((675343.5 12...
4  4 waterbodies        1 MULTIPOLYGON (((702393.8 12...
5  5 waterbodies        1 MULTIPOLYGON (((688438.4 12...
Now I would like to rasterize this simple feature and resample it so that I further compute area statistics to compare with other rasters. To do so I have been struggling with using functions from both the stars and the terra package and each time, I believe I am losing values and data associated.
Let's start with functions from the stars package:
> new <- st_rasterize(waterBodies_nil1870)
> new
stars object with 2 dimensions and 2 attributes
attribute(s):
          Min. 1st Qu. Median     Mean 3rd Qu. Max.  NA's
id           1       2      2 2.547945       3    5 64790
gridcode     1       1      1 1.000000       1    1 64790
dimension(s):
  from  to  offset    delta                refsys point values x/y
x    1 259  667537  143.276 WGS 84 / UTM zone 43N FALSE   NULL [x]
y    1 251 1276926 -143.276 WGS 84 / UTM zone 43N FALSE   NULL [y]
In the above scenario, I have now lost the class attribute column and only id and gridcode are preserved for some reason. Notice that this error continues to surface even if I do: st_rasterize(waterBodies_nil1870["class"]).
Let's try functions from the terra package now:
v1 <- vect(waterBodies_nil1870)
> v1
 class       : SpatVector
 geometry    : polygons
 dimensions  : 5, 3  (geometries, attributes)
 extent      : 667536.9, 704538.2, 1240976, 1276926  (xmin, xmax, ymin, ymax)
 coord. ref. : WGS 84 / UTM zone 43N (EPSG:32643)
 names       :    id       class gridcode
 type        : <num>       <chr>    <num>
 values      :     1 waterbodies        1
                   2 waterbodies        1
                   3 waterbodies        1

> r1 <- rast(v1)
> r1
class       : SpatRaster
dimensions  : 10, 10, 1  (nrow, ncol, nlyr)
resolution  : 3700.129, 3595.036  (x, y)
extent      : 667536.9, 704538.2, 1240976, 1276926  (xmin, xmax, ymin, ymax)
coord. ref. : WGS 84 / UTM zone 43N (EPSG:32643)
> hasValues(r1)
[1] FALSE
How do I rasterize a simple features object and then resample it using R?


