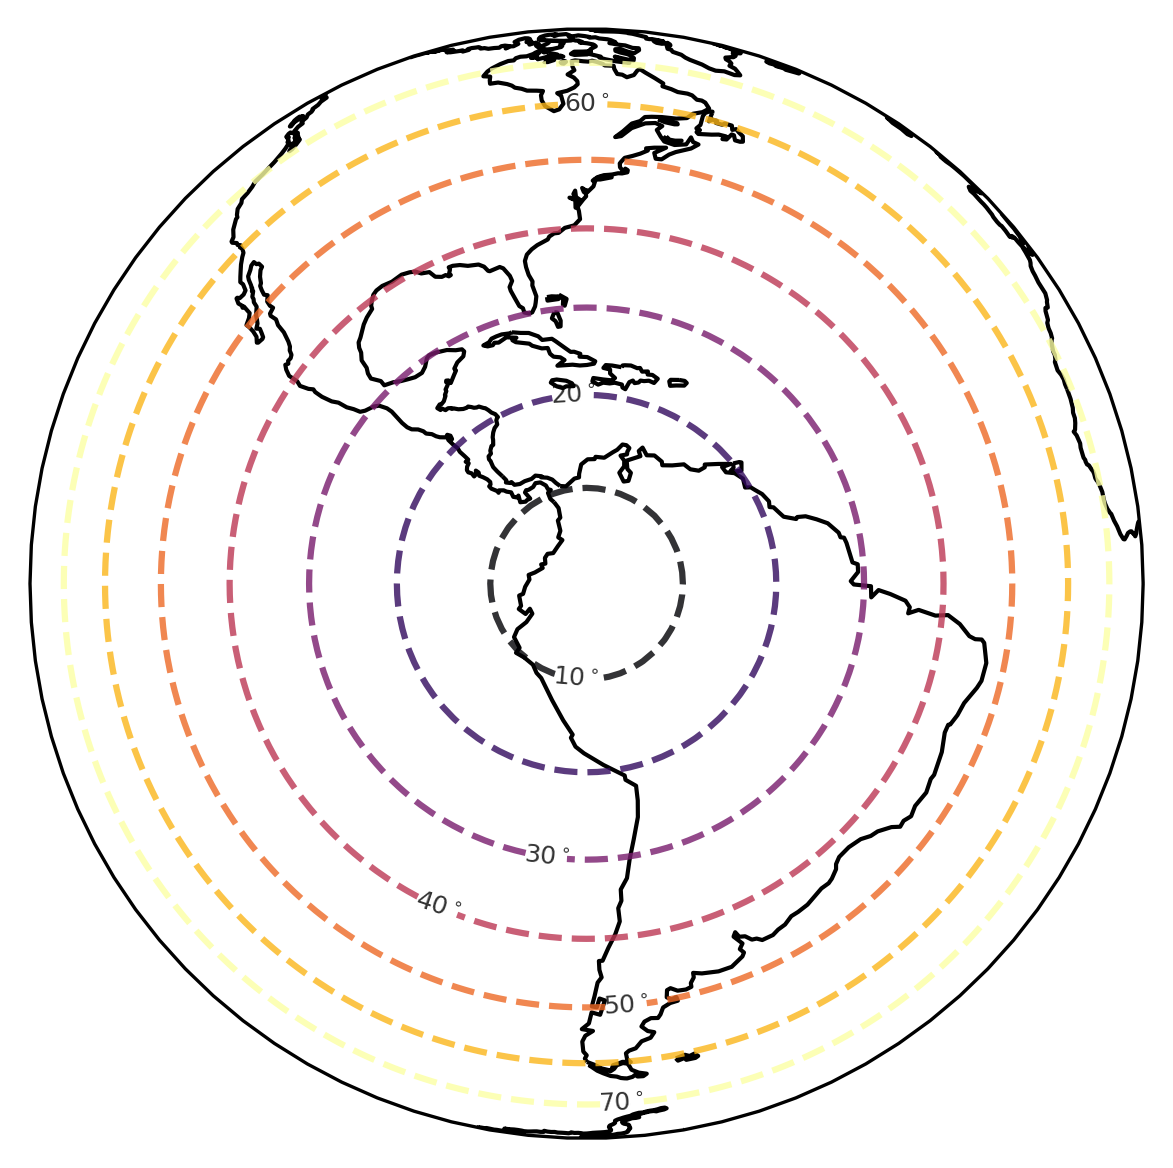
I'd really like to show the satellite zenith angle as seen from an observer on the ground. I can calculate everything just fine and get a graph that is useful and passable.
import numpy as np
import cartopy.crs as ccrs
import matplotlib.pyplot as plt
import datetime
from pyorbital.orbital import get_observer_look

proj_def = {'long_name': 'GOES-R ABI fixed grid projection','grid_mapping_name': 'geostationary','perspective_point_height': 35786023.0,'semi_major_axis': 6378137.0,'semi_minor_axis': 6356752.31414,'inverse_flattening': 298.2572221,'latitude_of_projection_origin': 0.0,'longitude_of_projection_origin': -75.0,'sweep_angle_axis': 'x'}

globe = ccrs.Globe(
    inverse_flattening = proj_def['inverse_flattening'],
    semimajor_axis = proj_def['semi_major_axis'],
    semiminor_axis = proj_def['semi_minor_axis']
)

plate = ccrs.PlateCarree()
proj = ccrs.Geostationary(
    central_longitude=proj_def['longitude_of_projection_origin'],
    satellite_height=proj_def['perspective_point_height'],
    false_easting=0,
    false_northing=0,
    globe=globe,
    sweep_axis=proj_def['sweep_angle_axis']
)

satlat = proj_def['latitude_of_projection_origin']
satlon = proj_def['longitude_of_projection_origin']
sath = proj_def['perspective_point_height']
sattime = datetime.datetime(2021, 2, 10, 18, 2, 25, 522423)

xs, ys = np.meshgrid(np.arange(-180, 180), np.arange(-90, 90))

az, el = get_observer_look(
    satlon, satlat, sath/1000,
    sattime,
    xs, ys, 0)

el = 90 - np.where(el < 0, np.nan, el)

levels = np.arange(10, 71, 10)

def fmt(x):
    return f"{x:.0f}$^\circ$"

fig, ax = plt.subplots(dpi=300, subplot_kw=dict(projection=proj))

mappable = ax.contour(
    xs, ys, el,
    transform=plate,
    levels=levels,
    cmap='inferno',
    alpha=0.8,
    linestyles='--'
)

ax.clabel(
    mappable, mappable.levels,
    inline=True,
    fmt=fmt,
    fontsize=6,
    colors='black',
)

ax.coastlines()
What I really want is to have the degree labels at the top left of each circle so that it is easy to find the angle of these lines specifically over the contiguous US. What I ended up doing, because often my brain is not as smart as it thinks it is, was finding the look angle along the equator and choosing the longitude that is closest to whole numbers of the look angle and pairing these longitudes with the levels of the look angle. That gives me this.
posx = np.arange(-75, -75-90.1, -0.5)
posy = np.full_like(posx, fill_value=satlat)

az, angles = get_observer_look(
    satlon, satlat, sath/1000,
    sattime,
    posx, posy, 0)
angles = 90 - angles

it = iter(levels)
level = next(it)
idxs = []
for idx, a in enumerate(angles):
    if np.isclose(a, level, 0.1):
        idxs.append(idx)
        level = next(it, None)
        if level is None: break

label_x_locs = posx[idxs]

transformed = proj.transform_points(x=label_x_locs, y=levels, src_crs=plate)
_xs, _ys = transformed[:,0], transformed[:,1]
manual = list(zip(_xs, _ys))

fig, ax = plt.subplots(dpi=300, subplot_kw=dict(projection=proj))

mappable = ax.contour(
    xs, ys, el,
    transform=plate,
    levels=levels,
    cmap='inferno',
    alpha=0.8,
    linestyles='--'
)

ax.clabel(
    mappable, mappable.levels,
    inline=True,
    fmt=fmt,
    fontsize=6,
    colors='black',
    manual=manual
)

ax.scatter(_xs, _ys, transform=proj)
ax.set_xlim((-5434182.0342756845, 5434182.0342756845))
ax.set_ylim((-5412936.576233523, 5412936.576233523))

ax.coastlines()
This is clearly wrong because it's obviously not a great circle, which I didn't see until I plotted the points. So I guess I need to find points along a great circle with an angle of -45 degrees from polar north, but I don't know how to do that. Any ideas?
Edit:
I'm close.
from geographiclib.geodesic import Geodesic

line = Geodesic.WGS84.Line(
    lat1=proj_def['latitude_of_projection_origin'],
    lon1=proj_def['longitude_of_projection_origin'],
    azi1=-30
)


_xs, _ys = [], []

for level in np.arange(0, 90.1, 0.1):
    pos = line.ArcPosition(level)
    _xs.append(pos['lon2'])
    _ys.append(pos['lat2'])

az, angles = get_observer_look(
    satlon, satlat, sath/1000,
    sattime,
    _xs, _ys, 0)
angles = 90 - angles

it = iter(levels)
level = next(it)
idxs = []
for idx, a in enumerate(angles):
    if np.isclose(a, level, 0.1):
        idxs.append(idx)
        level = next(it, None)
        if level is None: break

label_x_locs = np.array(_xs)[idxs]
label_y_locs = np.array(_ys)[idxs]

transformed = proj.transform_points(x=label_x_locs, y=label_y_locs, src_crs=plate)
_xs, _ys = transformed[:,0], transformed[:,1]
manual = list(zip(_xs, _ys))

fig, ax = plt.subplots(dpi=300, subplot_kw=dict(projection=proj))

mappable = ax.contour(
    xs, ys, el,
    transform=plate,
    levels=levels,
    cmap='inferno',
    alpha=0.8,
    linestyles='--'
)

ax.clabel(
    mappable, mappable.levels,
    inline=True,
    fmt=fmt,
    fontsize=6,
    colors='black',
    manual=manual
)

ax.coastlines()


