You can find the meaning of the quality bands here: https://www.usgs.gov/core-science-systems/nli/landsat/landsat-collection-2-quality-assessment-bands (under maintenance)
However, if you are using Python and you want a library that loads those bands for you (already in TB), you could use EOReader directly:
from eoreader.reader import Reader
from eoreader.bands import TIR_1, CLOUDS

prod = Reader().open(r"LC08_L1TP_200030_20201220_20210310_02_T1.tar")

# Load those bands as a dict of xarray.DataArray
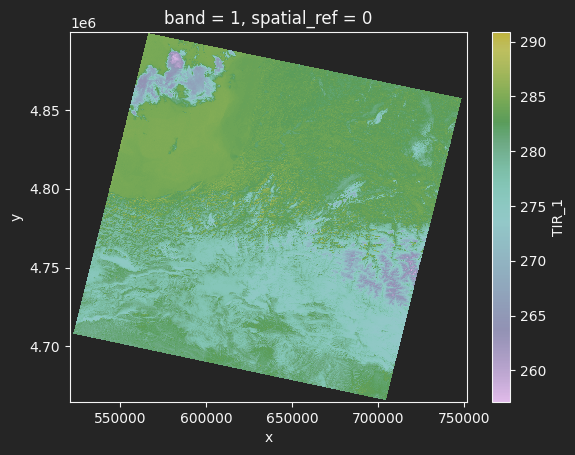
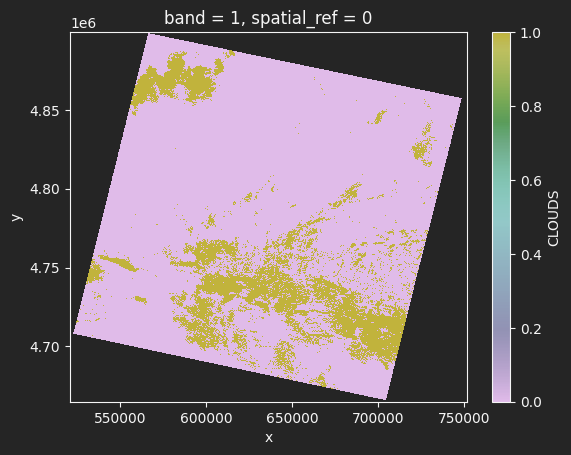
tb_bands = prod.load([TIR_1, CLOUDS])
tb_bands[TIR_1].plot(cmap="viridis")
tb_bands[CLOUDS].plot()


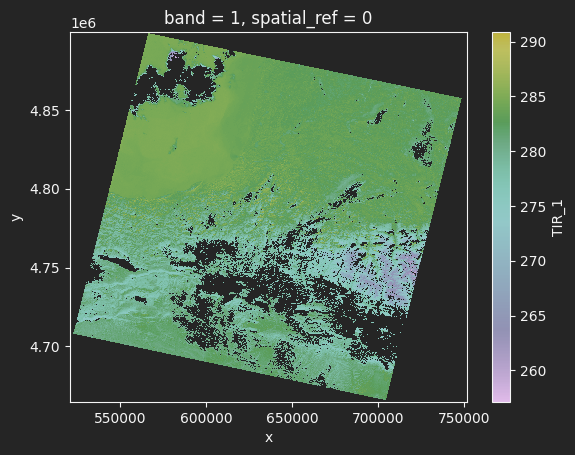
Then you just have to remove cloudy pixels:
cloud_free = tb_bands[TIR_1].where(tb_bands[CLOUDS] == 0)
cloud_free.plot(cmap="viridis")

Disclaimer : Disclaimer: I am the maintainer of EOReader


