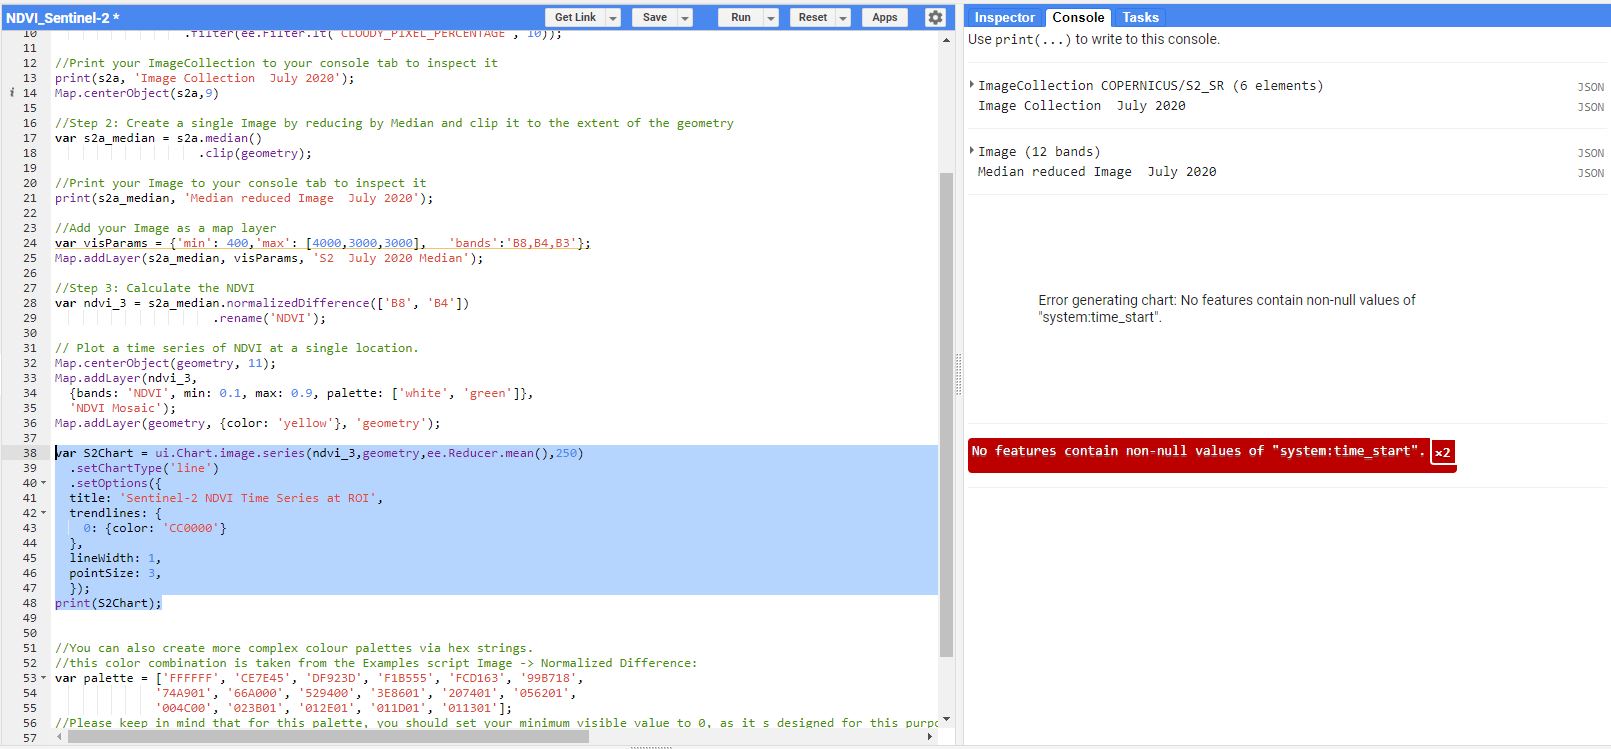
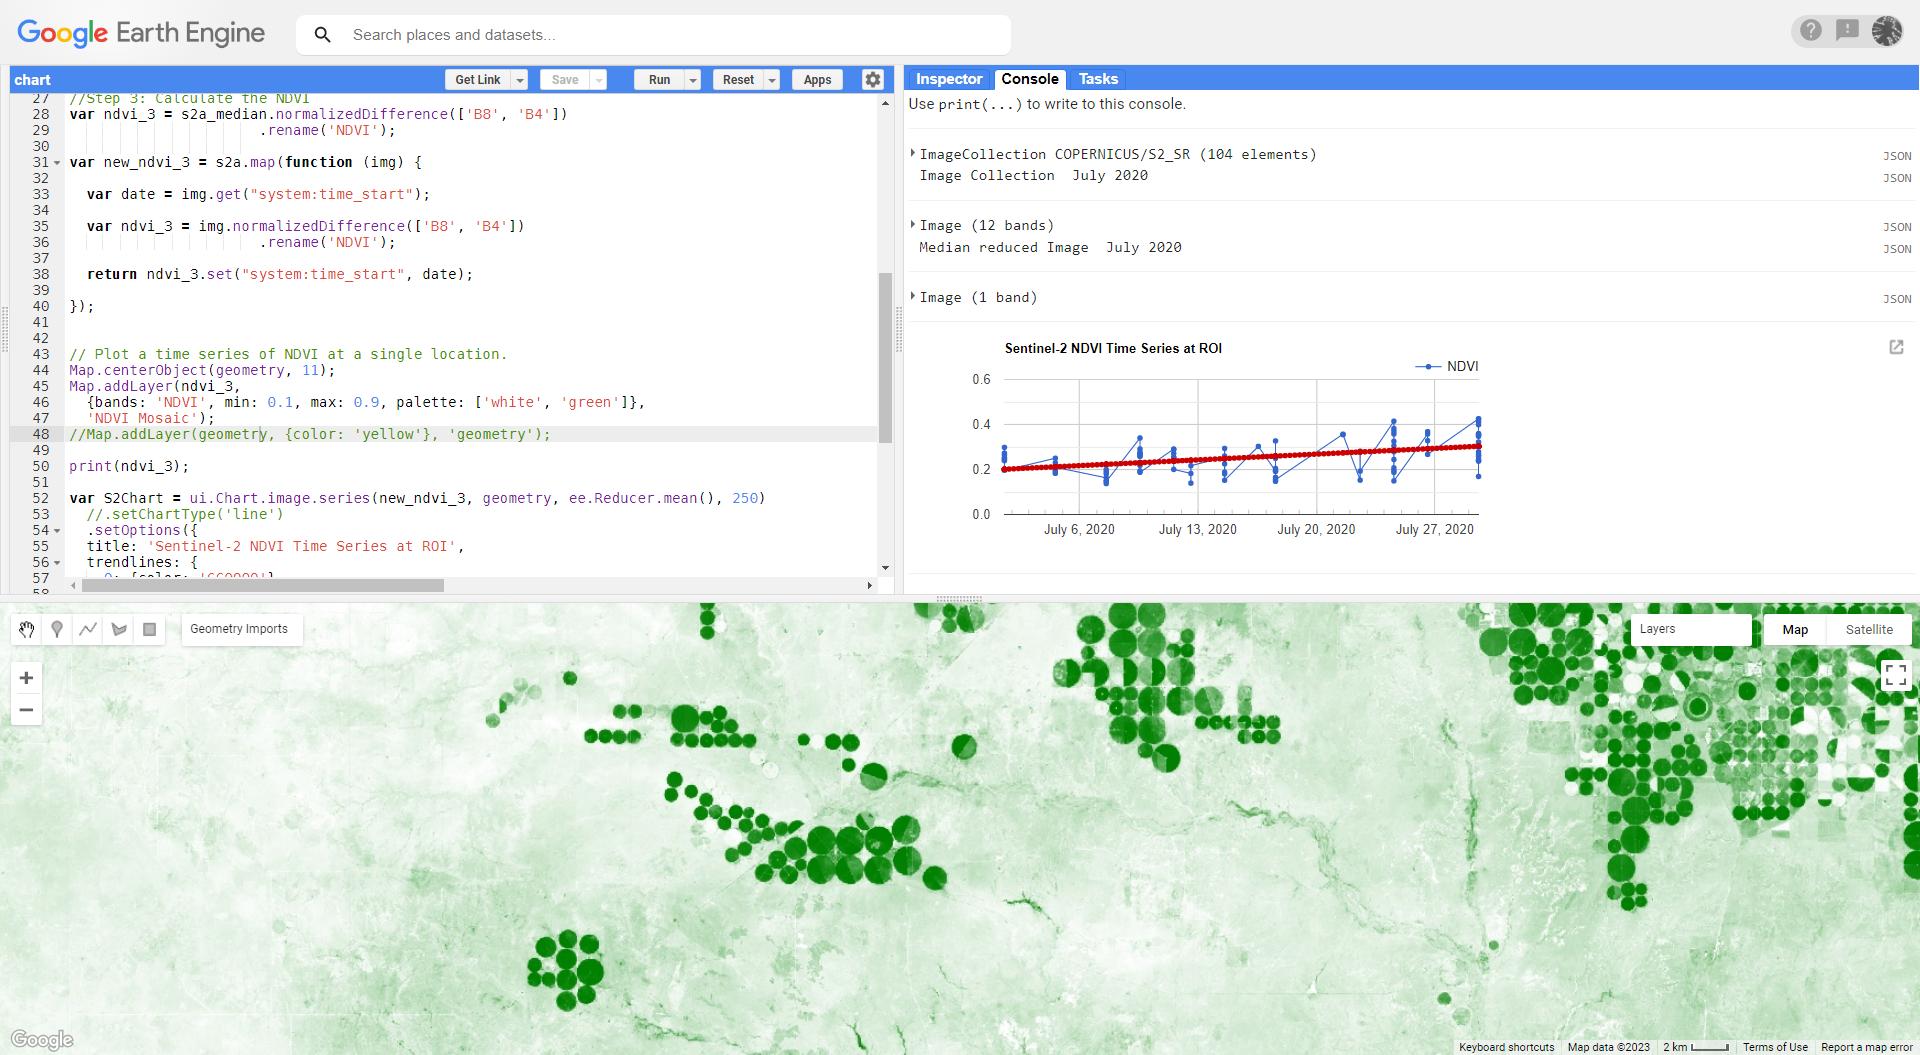
I cannot generate a chart, first the error was about reduce region now it is no features containing non-null.
//source; https://www.geo.fu-berlin.de/en/v/geo-it/gee/2-monitoring-ndvi-nbr/2-2-calculating-indices/ndvi-s2/index.html

// Compute Normalized Difference Vegetation Index over S2-L2 product.

//Step 1: Access the Sentinel-2 Level-2A data and filter it for all the the images of the year 2020 that lie within the geometries boundaries. Keep only the relevant bands and filter for cloud coverage.
var s2a = ee.ImageCollection('COPERNICUS/S2_SR')
                  .filterBounds(geometry)
                  .filterDate('2020-07-01', '2020-07-31')
                  .select('B1','B2','B3','B4','B5','B6','B7','B8','B8A','B9','B11','B12')
                  .filter(ee.Filter.lt('CLOUDY_PIXEL_PERCENTAGE', 10));

//Print your ImageCollection to your console tab to inspect it
print(s2a, 'Image Collection  July 2020');
Map.centerObject(s2a,9)

//Step 2: Create a single Image by reducing by Median and clip it to the extent of the geometry
var s2a_median = s2a.median()
                    .clip(geometry);

//Print your Image to your console tab to inspect it
print(s2a_median, 'Median reduced Image  July 2020');

//Add your Image as a map layer
var visParams = {'min': 400,'max': [4000,3000,3000],   'bands':'B8,B4,B3'};
Map.addLayer(s2a_median, visParams, 'S2  July 2020 Median');

//Step 3: Calculate the NDVI
var ndvi_3 = s2a_median.normalizedDifference(['B8', 'B4'])
                      .rename('NDVI');

// Plot a time series of NDVI at a single location.
Map.centerObject(geometry, 11);
Map.addLayer(ndvi_3,
  {bands: 'NDVI', min: 0.1, max: 0.9, palette: ['white', 'green']},
  'NDVI Mosaic');
Map.addLayer(geometry, {color: 'yellow'}, 'geometry');

var S2Chart = ui.Chart.image.series(ndvi_3,geometry,ee.Reducer.mean(),250)
  .setChartType('line')
  .setOptions({
  title: 'Sentinel-2 NDVI Time Series at ROI',
  trendlines: {
    0: {color: 'CC0000'}
  },
  lineWidth: 1,
  pointSize: 3,
  });
print(S2Chart);


//You can also create more complex colour palettes via hex strings.
//this color combination is taken from the Examples script Image -> Normalized Difference:
var palette = ['FFFFFF', 'CE7E45', 'DF923D', 'F1B555', 'FCD163', '99B718',
              '74A901', '66A000', '529400', '3E8601', '207401', '056201',
              '004C00', '023B01', '012E01', '011D01', '011301'];
//Please keep in mind that for this palette, you should set your minimum visible value to 0, as it s designed for this purpose.
//This is due to it being a gradient from brown to green tones, with a heavy focus on the green side. If we would set min: -1, NDVI = 0 would already be displayed in a dark green tone.
//You can recognize this by checking the palette-section of your layer information for ndvi_3.

//Display the input image and the NDVI derived from it.
Map.addLayer(ndvi_3, {min: 0, max: 1, palette: palette}, 'NDVI  July 2020 V3')


