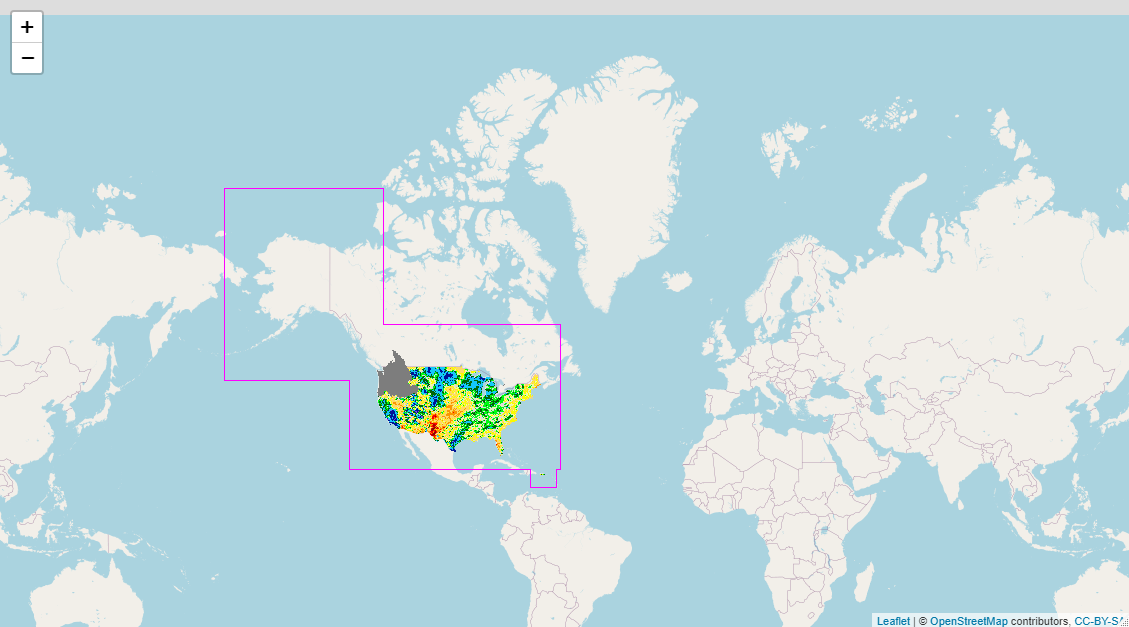
I am attempting to display an interactive map of past rainfall using leaflet in R. The best available data I was pointed to was located here: https://mapservices.weather.noaa.gov/raster/rest/services/obs/rfc_qpe/MapServer
The example layer I am trying to display is rainfall accumulation from the past 24-hours, indicated as layer 28. When trying to display with leaflet, the data does not seem to show, and no errors are given:
library(leaflet)

url = "https://mapservices.weather.noaa.gov/raster/rest/services/obs/rfc_qpe/MapServer"

leaflet() %>%
  addTiles() %>%
  addWMSTiles(url,
              layers="0",
              layerId = '28',
              options = WMSTileOptions(format = "image/png",
                                       transparent = TRUE,
                                       opacity=.7),
              group = "24-Hr Accumulation") %>%
  addLayersControl(overlayGroups = "24-Hr Accumulation")

Created on 2023-05-17 with reprex v2.0.2
Presumably, my issue is with the layers = "0" and layerId = "28" arguments.


https://mapservices.weather.noaa.gov/raster/services/obs/rfc_qpe/MapServer/WMSServer?"28".layers="28",layerIdis not a WMS parameter, but I don't know R, so not sure if it is translated to a valid WMS parameter when the request is generated. A valid WMS GetMap request for layer 28 would be: mapservices.weather.noaa.gov:443/raster/services/obs/rfc_qpe/…