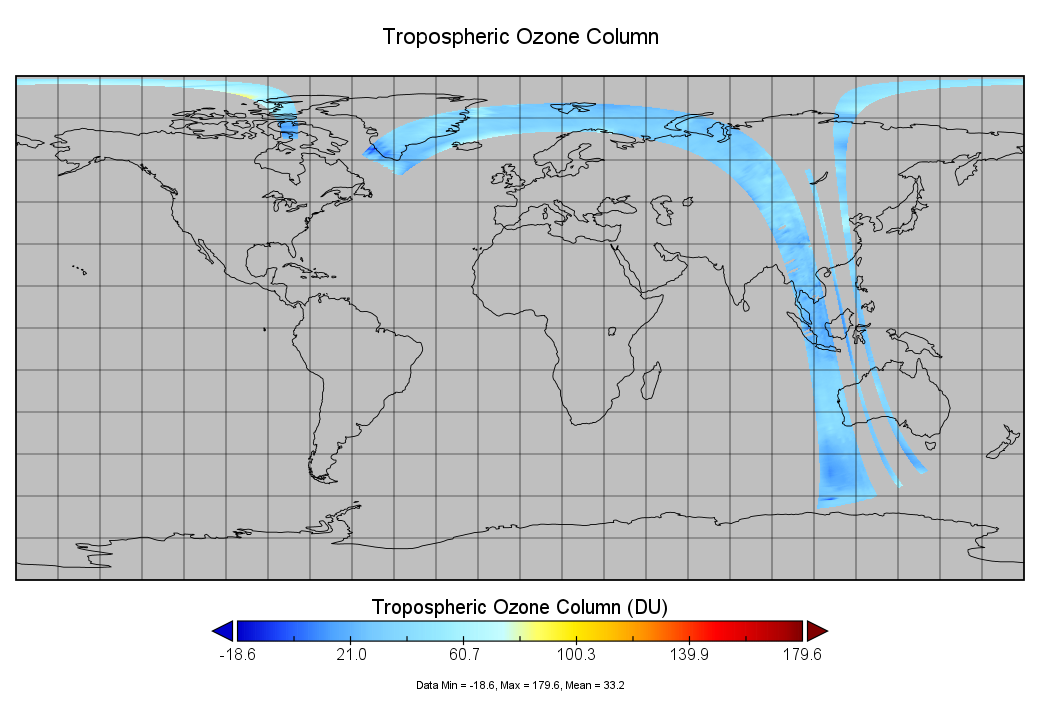
1

I studied the article 'Lower tropospheric ozone over India and its linkage to the South Asian monsoon' and the article 'Validation of 10-year SAO OMI ozone profile (PROFOZ) product using Aura MLS measurements'. Thereby, I'm looking for tropospheric ozone, and I found OMPROFOZ data in the GODDARD SPACE data catalog.

I'd like to convert a subset from HDF5 to GeoTIFF. Thereby I'm trying to convert the OMI PROFOZ ozone layer provided in HDF5 to the GeoTIFF format using gdal_translate() in the R environment.

I found the full name of the variable is HDFEOS/SWATHS/OMI_Vertical_Ozone_Profile/Data_Fields/O3TroposphericColumn.

The data is OMPROFOZ ozone layer downloaded from this link clic here

An example of the HDF5 file can be download here -

I already tried gdal_translate() to extract the subsect and convert the HDF5 to GeoTIFF in the R environment, which gives me this result: OMPROFOZ O3 process in R platform
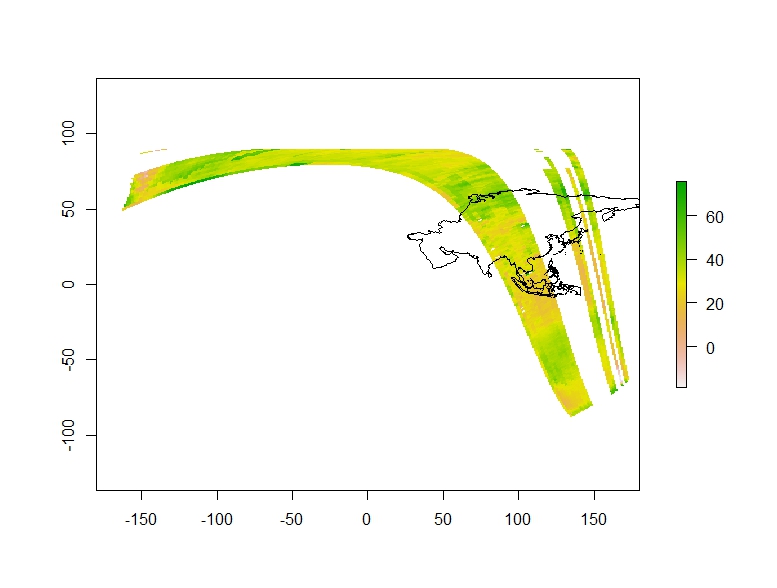
However, this result don't match with the cordinate of my shape file, insted i ploted it in panoply platform My code:

library(gdalUtilities)
library(gdalUtils)
library(raster)
fname = 'G:\\O3_Data\\OMI-Aura_L2-PROFOZ_2010m0701t0533-o31702_v003-2013m0108t100600.he5'
gdalinfo(fname)
sds <- get_subdatasets(fname)
sds
gdal_translate(sds[26], dst_dataset = "G:\\O3_Data\\O3_20100701.tif",a_ullr=c(), format="GTiff")

gdalwarp("G:\\O3_Data\\O3_20100701.tif",dstfile="G:\\O3_Data\\O3_20100701_project_7.tif",
         t_srs="EPSG:3410",
         # t_srs='EPSG:4326',
         output_Raster=TRUE,
         overwrite=TRUE,verbose=TRUE)


rastt <- raster("G:\\O3_Data\\O3_20100701_project_7.tif")
plot(rastt)
extent(rastt)=c(xmn=-180, xmx=180, ymn=-90, ymx=90)
plot(rastt)

asia <- shapefile('D:\\other2020_22\\shapfile\\Asis_final_export\\asia_final.shp')
# add polygons
plot(asia, add=TRUE, axes=F)

My shapefile- download here

panoply plot- view

1 Answer 1

2

I think its because you are falsely assigning it a new extent at this point:

extent(rastt)=c(xmn=-180, xmx=180, ymn=-90, ymx=90)

Its projected extent in its coordinate system (EPSG:3410) is:

> extent(rastt)
class      : Extent 
xmin       : -8403326 
xmax       : 14120337 
ymin       : -7287267 
ymax       : 7264838 

Which I can make into points and then translate to lat-long:

ep = st_as_sf(data.frame(matrix(extent(rastt), ncol=2)), coords=1:2, crs=3410)
st_transform(ep, 4326)
# Simple feature collection with 2 features and 0 fields
# Geometry type: POINT
# Dimension:     XY
# Bounding box:  xmin: -87.26098 ymin: -82.11291 xmax: 146.627 ymax: 80.92823
# Geodetic CRS:  WGS 84
#                     geometry
# 1 POINT (-87.26098 -82.11291)
# 2    POINT (146.627 80.92823)

Which will probably have the effect of misaligning it with the world. Not only will it mess up the apparent range, but the raster still thinks it is in EPSG:3410, and these are now coordinates in metres.

So, I don't know why you reassign it to an invalid extent, but if you don't do that then it looks fine. Have tested in R and QGIS.

If you really want it in lat-long, then gdalwarp again to EPSG:4326 or use `raster::projectRaster

rw = projectRaster(rastt, crs="+init=epsg:4326")
1
  • I tried many times to reproject (raster::projectRaster) the raster to the EPSG:4326 projection system, but the raster O3 layer doesn't line up with the shape file. instead, panoply plots the O3 data perfectly with all projections. Commented Jul 8, 2023 at 14:33

Your Answer

By clicking “Post Your Answer”, you agree to our terms of service and acknowledge you have read our privacy policy.

Not the answer you're looking for? Browse other questions tagged or ask your own question.