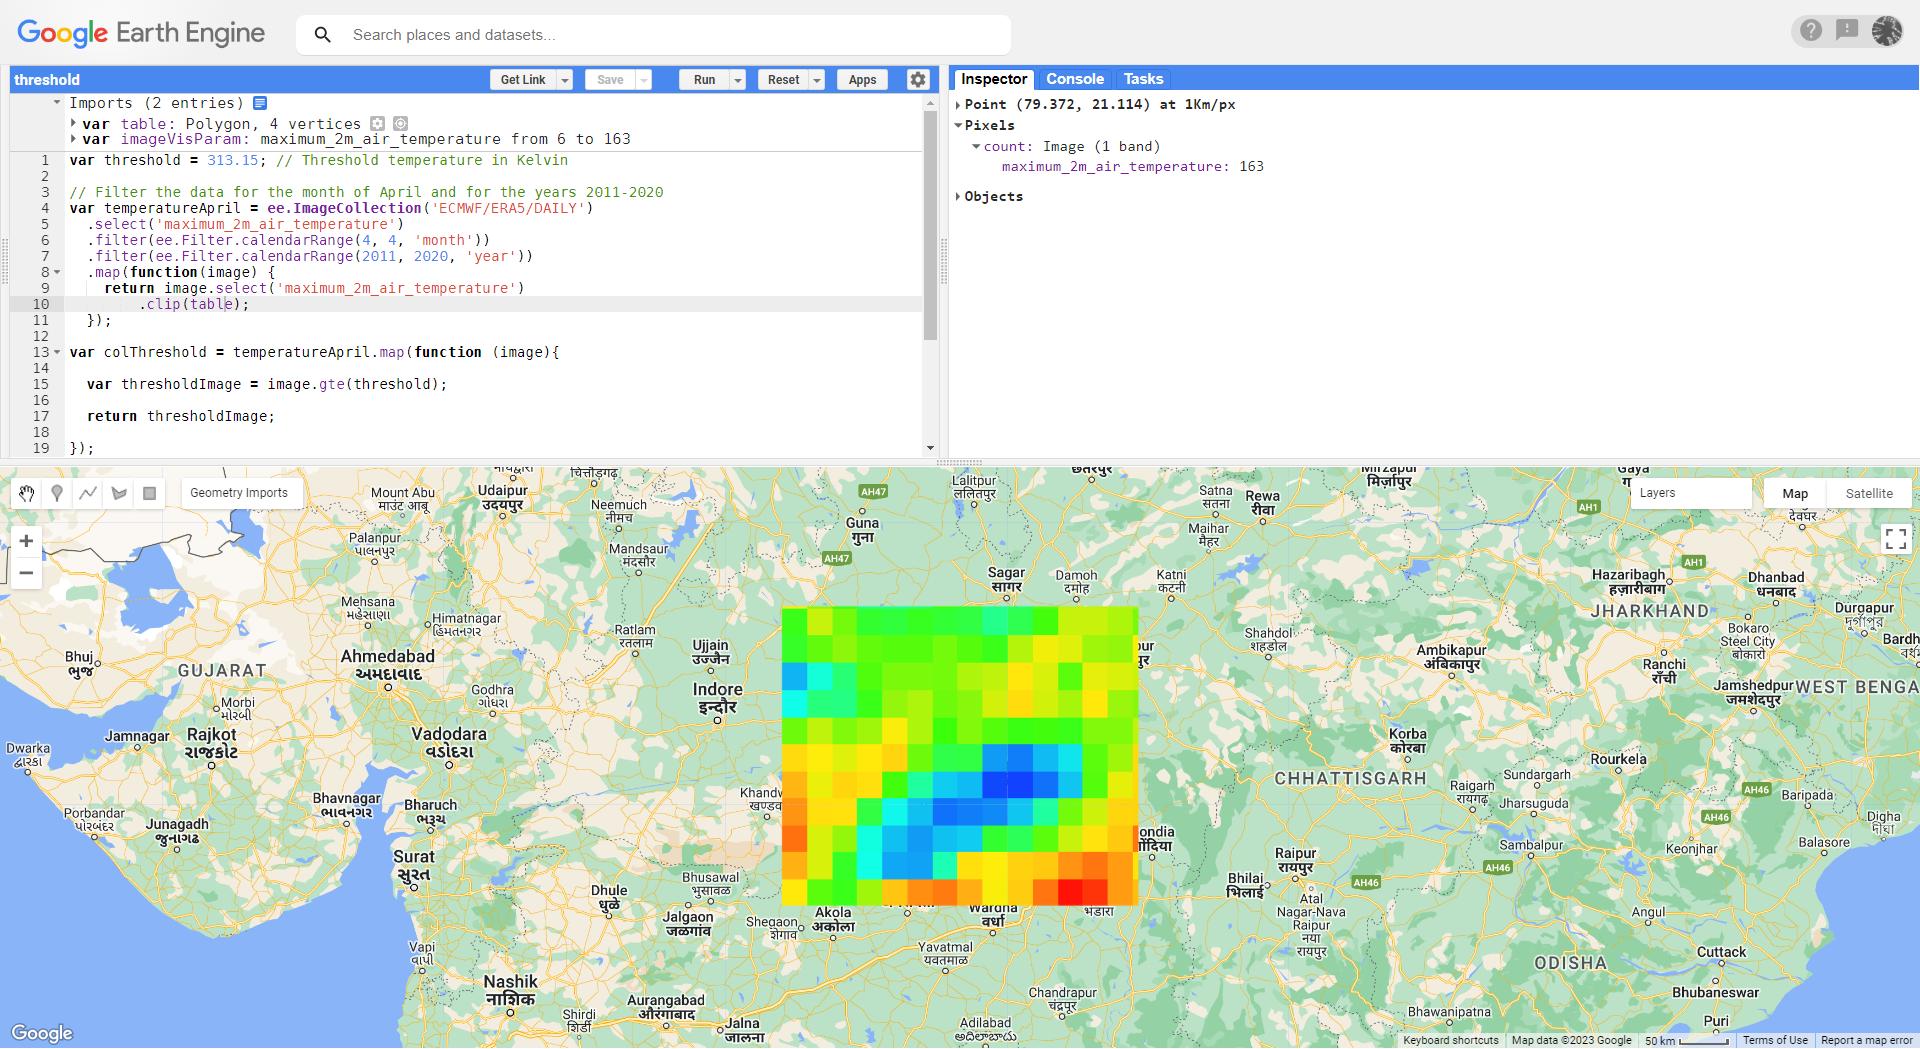
I am trying to generate a raster where each pixel will show a trend of days exceeding a particular threshold of maximum temperature in GEE. I have calculated the number of days exceeding the threshold of maximum temperature for each year. I have written the code below but I think I am wrong somewhere.
var threshold = 313.15; // Threshold temperature in Kelvin

// Filter the data for the month of April and for the years 2011-2020
var temperatureApril = ee.ImageCollection('ECMWF/ERA5/DAILY')
  .select('maximum_2m_air_temperature')
  .filter(ee.Filter.calendarRange(4, 4, 'month'))
  .filter(ee.Filter.calendarRange(2011, 2020, 'year'))
  .map(function(image) {
    var mask = image.select('maximum_2m_air_temperature').gte(threshold);
    return image.select('maximum_2m_air_temperature').gte(threshold)
        .updateMask(mask)
        .clip(table);
  });

// Print the filtered collection
print('Filtered temperature for April and above threshold:', temperatureApril);
// Function to calculate the sum of days exceeding the threshold for each year
var calculateSumForYear = function(year) {
  var filteredByYear = temperatureApril.filter(ee.Filter.calendarRange(year, year, 'year'));
  var sumForYear = filteredByYear.count();
  return sumForYear.set('year', year);
};

// Calculate the sum of days exceeding the threshold for each year
var years = ee.List.sequence(2011, 2020);
var sumPerYear = ee.ImageCollection.fromImages(years.map(calculateSumForYear));

// Print the sum of days exceeding the threshold for each year
print('Count of days exceeding the threshold for each year:', sumPerYear);
I would then like to do a trend for days exceeding the threshold over the years (2011-2020) by using the Mankendall method.

