0

I am trying to interpolate a raster using ordinary kriging. When I use the data from meuse to try the model, I get an interpolated output. However, when I run the code with my own data, the interpolation looks exactly like my original raster.

Here is an example of my data. As I said, I am providing this as data(meuse) is apparently computing right.

aggregated_raster_df <- data.frame (x = c(16.125, 16.375, 16.625, 16.875, 17.125,
17.375, 17.625, 17.875, 16.125, 16.375, 16.625, 16.875, 17.125,
17.375, 17.625, 17.875, 16.125, 16.375, 16.625, 16.875, 17.125, 
17.375, 17.625, 17.875, 16.125, 16.375, 16.625, 16.875, 17.125, 
17.375, 17.625, 17.875, 16.125, 16.375, 16.625, 16.875, 17.125, 
17.375, 17.625, 17.875, 16.125, 16.375, 16.625, 16.875, 17.125, 
17.375, 17.625, 17.875, 16.125, 16.375, 16.625, 16.875, 17.125, 
17.375, 17.625, 17.875, 16.125, 16.375, 16.625, 16.875, 17.125, 
17.375, 17.625, 17.875), y = c(-23.125, -23.125, -23.125, -23.125, 
-23.125, -23.125, -23.125, -23.125, -23.375, -23.375, -23.375, 
-23.375, -23.375, -23.375, -23.375, -23.375, -23.625, -23.625, 
-23.625, -23.625, -23.625, -23.625, -23.625, -23.625, -23.875, 
-23.875, -23.875, -23.875, -23.875, -23.875, -23.875, -23.875, 
-24.125, -24.125, -24.125, -24.125, -24.125, -24.125, -24.125, 
-24.125, -24.375, -24.375, -24.375, -24.375, -24.375, -24.375, 
-24.375, -24.375, -24.625, -24.625, -24.625, -24.625, -24.625, 
-24.625, -24.625, -24.625, -24.875, -24.875, -24.875, -24.875, 
-24.875, -24.875, -24.875, -24.875), sum = c(26, 24, 33, 10, 
20, 7, 4, 0, 100, 27, 54, 33, 100, 8, 14, 39, 100, 90, 37, 3, 
4, 1, 3, 3, 100, 37, 30, 0, 1, 10, 8, 24, 79, 100, 11, 0, 2, 
8, 79, 100, 100, 100, 5, 16, 1, 3, 1, 100, 100, 100, 3, 20, 18, 
5, 5, 85, 100, 33, 4, 72, 7, 6, 5, 12))

Here is my code:

extent <- c(16,18,-25,-23)
blankRaster <- rast(ext(extent), res=.25)

v <- variogram(sum~1, ~x+y, data=aggregated_raster_df)
mv <- fit.variogram(v, vgm(1000, "Exp", 3, 1))
gOK <- gstat(NULL, "sum", sum~1, aggregated_raster_df, locations=~x+y, model=mv)
OK <- interpolate(blankRaster, gOK, xyNames = c("x", "y"))

This is the output, where sum.original (the original raster) looks exactly the same as sum.pred (the output from the interpolation)

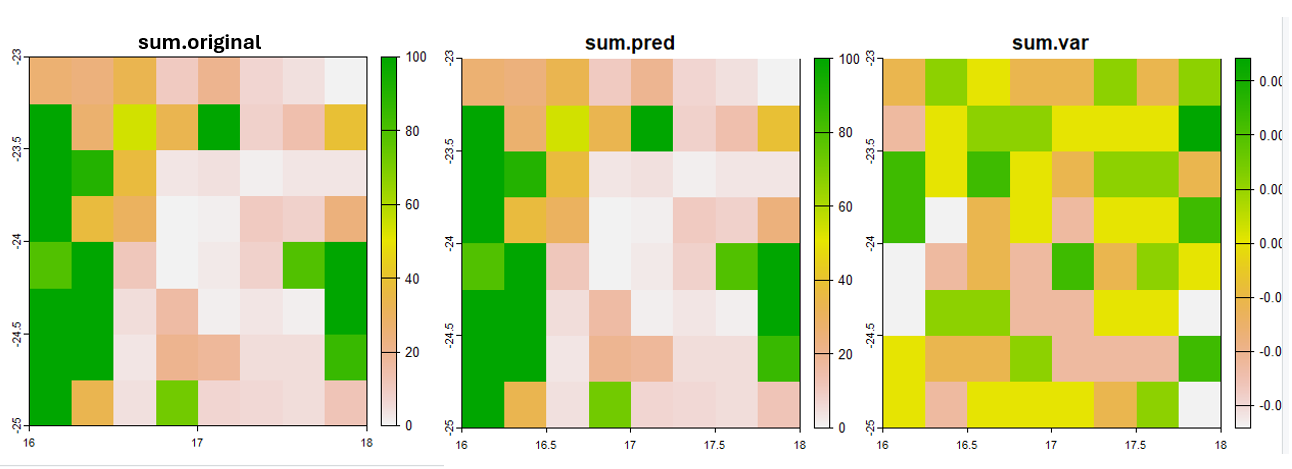
terra::interpolate input & output

1 Answer 1

1

Kriging is an exact interpolator, meaning its predicted values pass through the original data at the data point locations. If you feed it a regular grid of values then predict on that grid, you'll get the same values out. You should also get very small error estimates.

Predicting away from any input data point locations will result in predicted values close to the nearest points, but with error estimates increasing with distance to any data.

The meuse data is not on a regular grid, so predicting on a raster grid is unlikely to be predicting at any of the input locations.

3
  • Thanks for the input. So in theory if I would like to predict values in my grid using kriging I should erase the entries I'd like to interpolate? For example the 0's in my data frame? It does not sound like the right thing to do, I think. Which method could I use to interpolate the values I have?
    – msug
    Commented Feb 17 at 5:18
  • Kriging is used to estimate values where you don't have data. If you have data on the grid locations, then predicting at the grid locations will return the input values. There's no point predicting values on your grid because you already know the ground truth, and kriging returns that. Removing a zero would be sensible if the zero meant "no measurement taken here" and you want to know what the value would have been if a measurement had been taken. If a 0 was truly recorded here, you leave it in and kriging predicts zero at that location.
    – Spacedman
    Commented Feb 17 at 8:39
  • There's nothing to stop you using your grid of inputs to predict via kriging at a different set of grid points, for example something with 25 cells for every cell of your input grid. In this case you'll still get identical predictions if your new points coincide with the input points. It all depends on what you are trying to learn from your data.
    – Spacedman
    Commented Feb 17 at 8:41

Your Answer

By clicking “Post Your Answer”, you agree to our terms of service and acknowledge you have read our privacy policy.

Not the answer you're looking for? Browse other questions tagged or ask your own question.