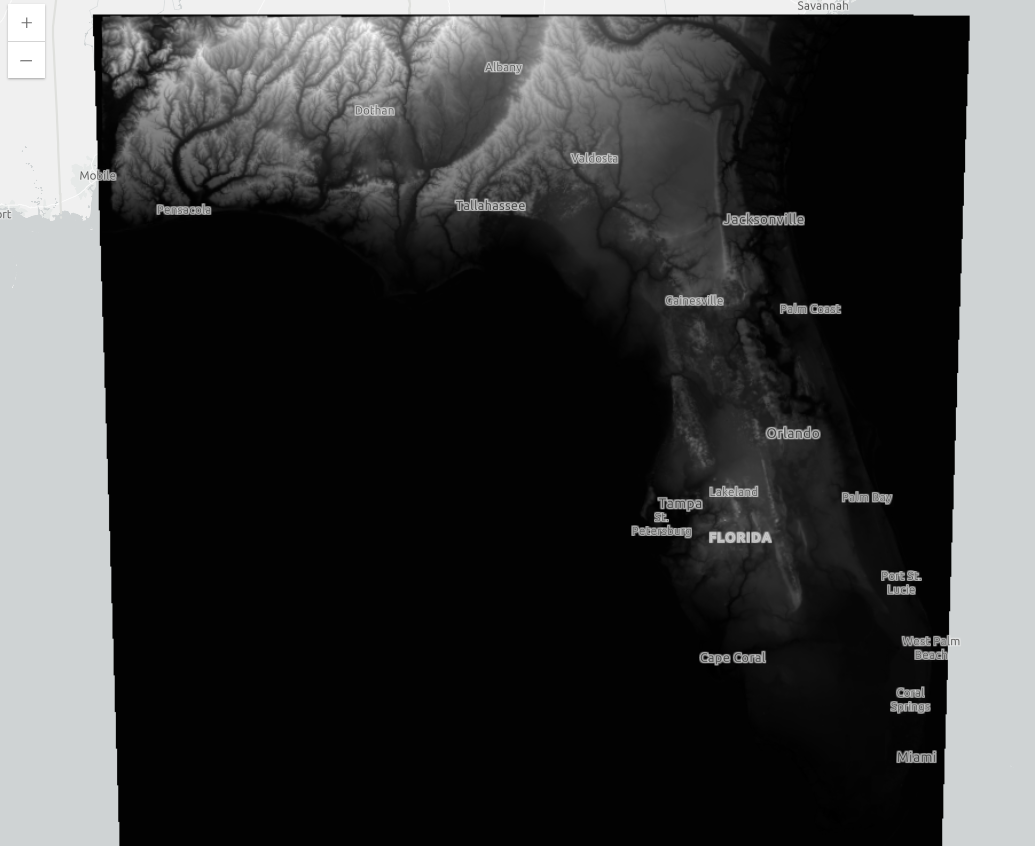
I have a DEM of the state of florida as an ImageService, here. I want to render this DEM using nicer colors than black and white using the ArcGIS JS API. Following the example ImageryTileLayer - shaded relief renderer , I apply a RasterShadedReliefRender as the imagelayer's renderer:
import RasterShadedReliefRenderer from "@arcgis/core/renderers/RasterShadedReliefRenderer";
import AlgorithmicColorRamp from "@arcgis/core/rest/support/AlgorithmicColorRamp.js";
import Color from "@arcgis/core/Color.js";
import MultipartColorRamp from "@arcgis/core/rest/support/MultipartColorRamp.js";

const renderer = new RasterShadedReliefRenderer({
  hillshadeType: "traditional",
  zFactor: 15,
  scalingType: "adjusted",
  colorRamp: new MultipartColorRamp({
    colorRamps: [
      new AlgorithmicColorRamp({
        fromColor: new Color("#2F86A6"),
        toColor: new Color("#12372A"),
      }),
    ],
  }),
});


const layer = new ImageryLayer({
  url: the_url_from_above,
  renderer
})
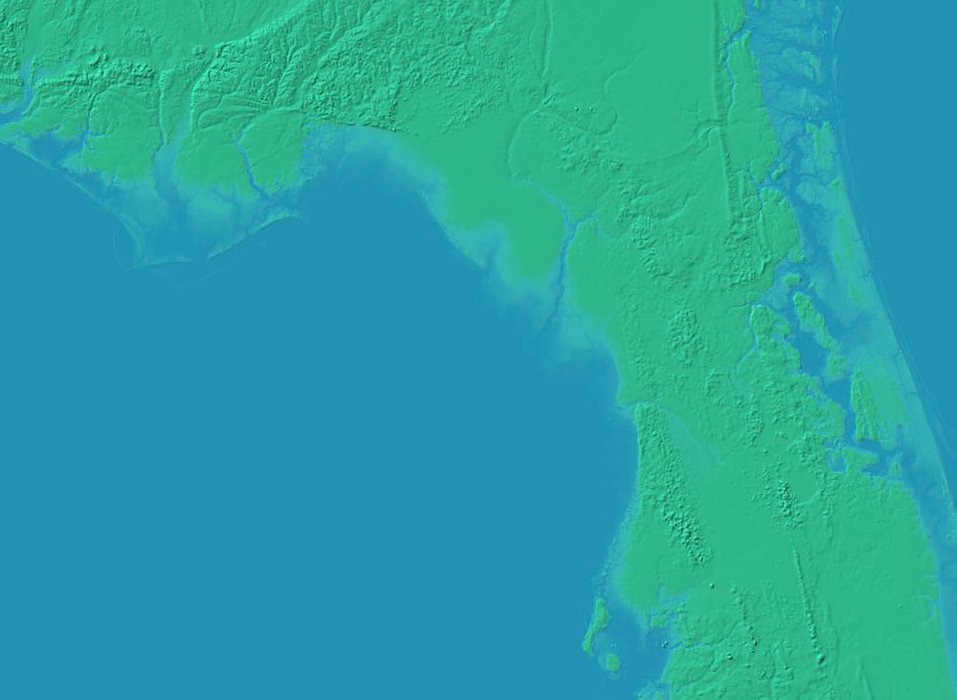
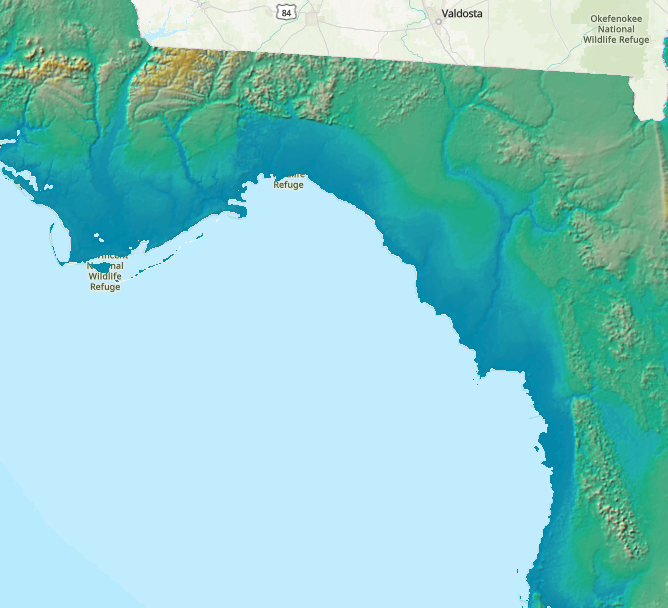
This is working, except the range of colors from the color ramp doesn't seem to span the full range of elevations in the layer. The resulting image:
You can see there is a nice gradient right around the sea level, but above that, the hillshade seems to be colored on more of a greyscale.
I tried adding more ramps within the colorRamp, but the same problem occurs. For example
export const renderer = new RasterShadedReliefRenderer({
  hillshadeType: "traditional",
  zFactor: 15,
  scalingType: "adjusted",
  colorRamp: new MultipartColorRamp({
    colorRamps: [
      new AlgorithmicColorRamp({
        fromColor: new Color("#2F86A6"),
        toColor: new Color("#12372A"),
      }),
      new AlgorithmicColorRamp({
        fromColor: new Color("#12372A"),
        toColor: new Color("#436850"),
      }),
      new AlgorithmicColorRamp({
        fromColor: new Color("#436850"),
        toColor: new Color("#ADBC9F"),
      }),
    ],
  }),
});
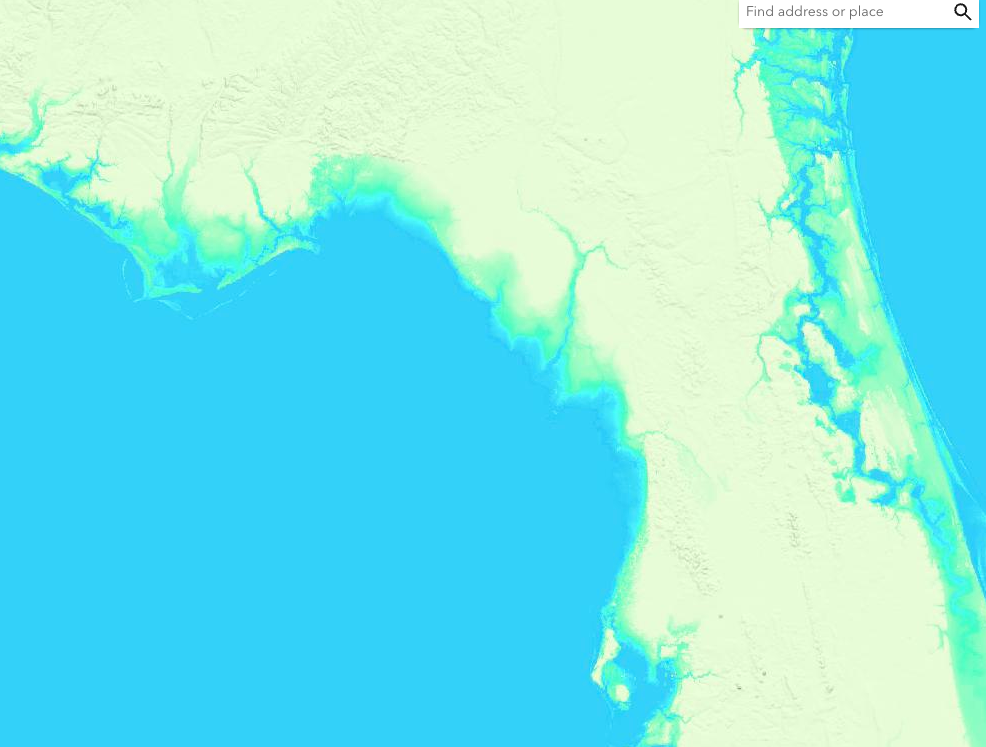
This results in:
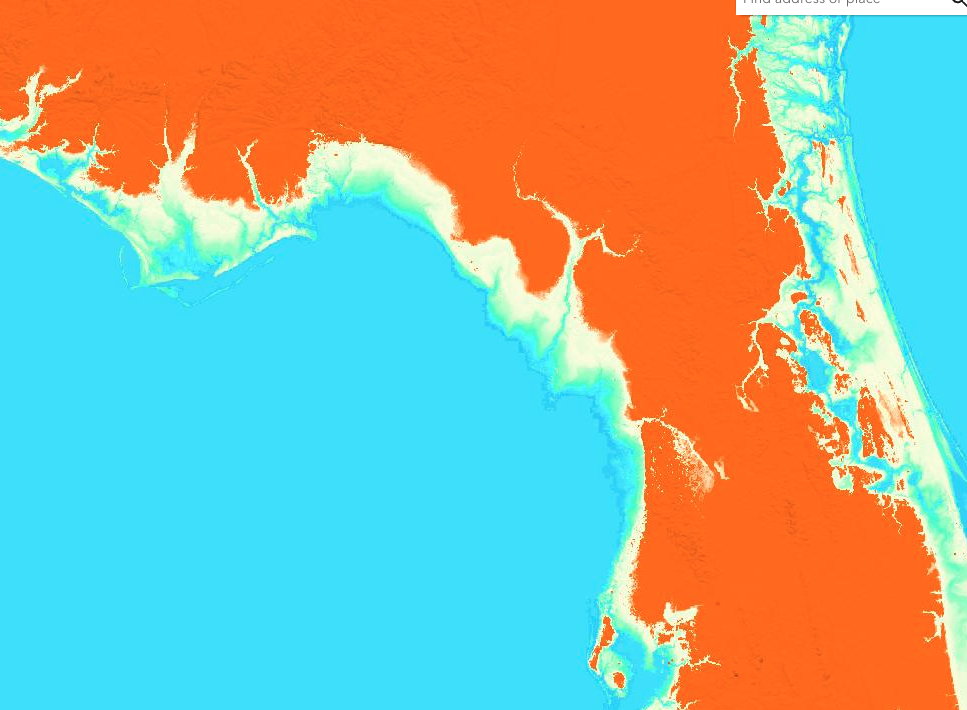
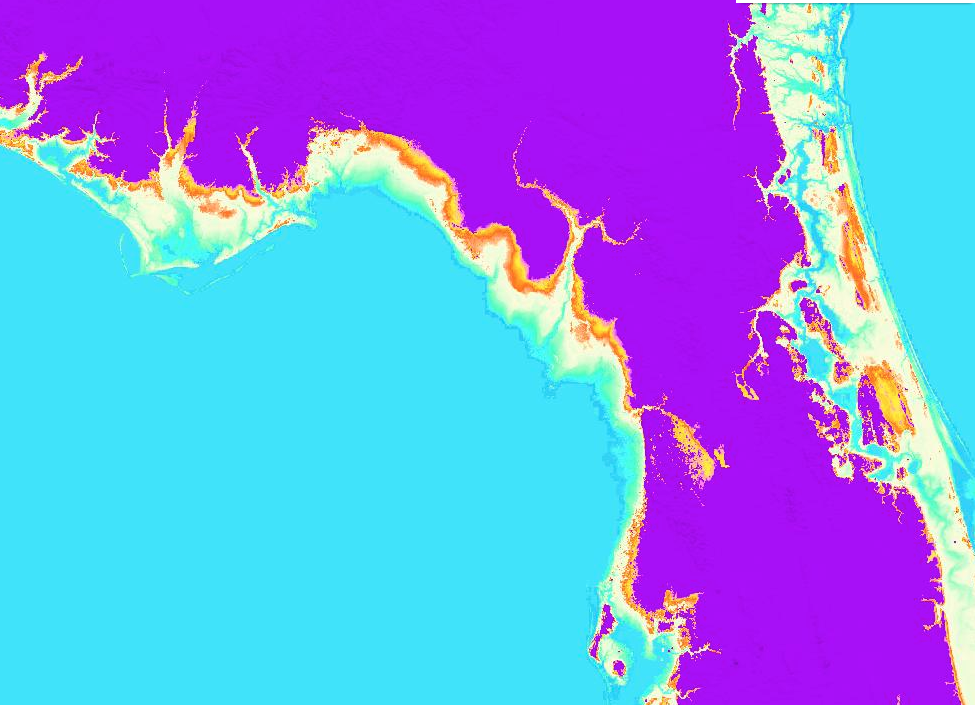
To make the point stupidly obviously, with more ridiculous colors added in there, I get results like these:
You can see that adding more color ramps just compresses the colors into the same range. While the colors are darker in the last images, you can see there is still more terrain being represented by a darkening of the last color.
The goal here is that the start of the color ramp should take the lowest value in the DEM, and the end of it should take the highest value in the DEM. That doesn't seem to be happening here.
What I doing wrong? How can I create a continuous color ramp that continuously belnds from the fromColor to the toColor across the range of values in the DEM ImageryLayer?
Edit: A working layer
I notice that when I try an alternative but older DEM, I get the desired result:
The difference that I see is that this older DEM is just of florida, and has a min and max value listed of 0-336 - the elevations in m within the state of Florida. And the serviceDataType is esriImageServiceDataTypeGeneric. Whereas the one that is not working, the min and max values are listed as -0.7808904001722112 and 13.772270436049439, and the Service Data Type is esriImageServiceDataTypeElevation. I don't quite understand this second one - why is the range of min and max values so small? What units is it in? How does esriImageServiceDataTypeGeneric differ from esriImageServiceDataTypeElevation, and how does that affect my shaded relief renderer?

