I am brand new to QGIS and GIS in general. I am attempting to create a bathymetric map using data I collected myself. I am trying to use this tutorial: https://www.youtube.com/watch?v=dGDr3BrmmNw
The steps I have followed are:
- import csv data as a delimitted text layer (my csv file has latitude, longitude, and depth columns)
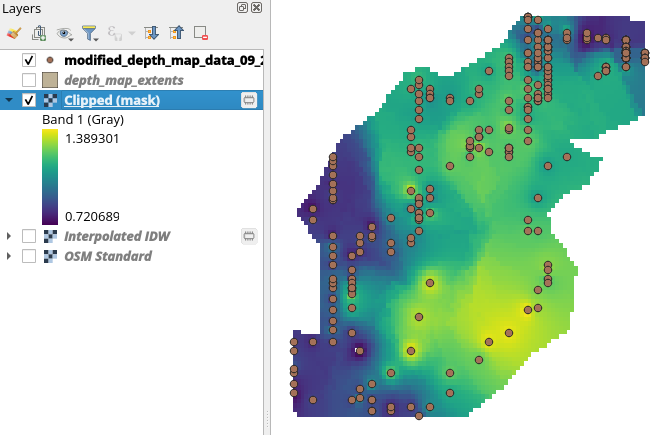
- draw polygon boundary around the points on another layer
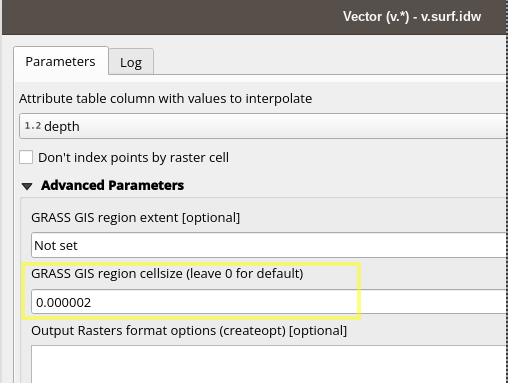
- use GRASS v.surf.idw to create the raster
- use the delimitted text vector layer as the input
- use defaults for other inputs
- select depth as the attribute value to interpret
- run
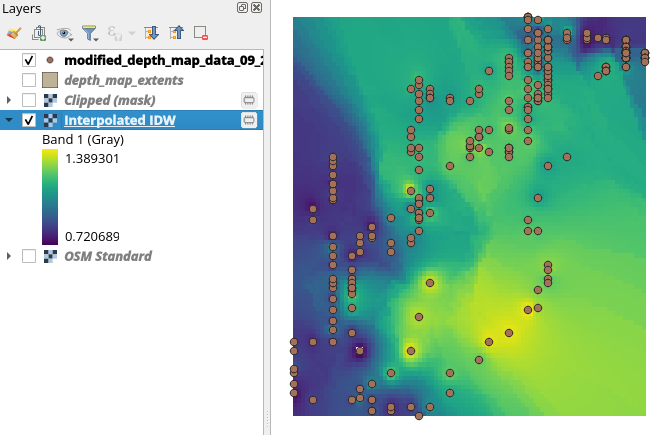
However, when using the v.surf.idw processing tool, the output is not what is expected. The output raster only has a single band (and the minimum and maximum values are the same number which is 1.033). Essentially there is no raster at all showing up but I cannot figure out where I am going wrong.
My full project files are located here: https://github.com/stonepreston/rio_vista_qgis
Can someone take a look and see if I am going way wrong somewhere? It seems simple to do, but I cannot for the life of me get it working.


