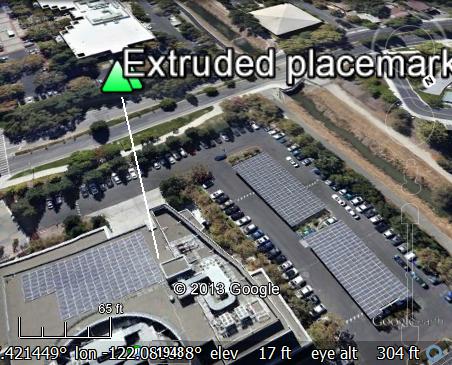
Extruding a point in KML will drop a line from the point to the ground if altimodeMode is absolute or relativeToGround.
The documentation on extrude on a Point states:
Specifies whether to connect the point to the ground with a line. To extrude a Point, the value for <altitudeMode> must be either relativeToGround, relativeToSeaFloor, or absolute. The point is extruded toward the center of the Earth's sphere.
See KML example with an extruded Point:
https://googlemaps.github.io/kml-samples/morekml/Point_Placemarks/Point_Placemarks.Extruded.kml

Alternatively, you may also want to consider scaling the icon image size and/or color correlating to the value or values you want to visualize.
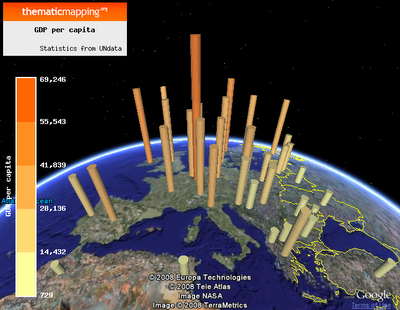
If you want to create thematic maps then you can extrude a colored polygon at a given altitude to create 3-D bar charts with geo-spatial data. Details and techniques can be found here.

Here's blog on creating 3D bars in KML:
http://blog.thematicmapping.org/2008/04/drawing-3d-bars-in-kml.html


