5

I'm trying to white a Python plugin in QGIS (2.2) to get, for each pixel of a raster image, its X Y coordinates, as well as, its RGB (3 bands) values.

At first I opened the raster file using: rlayer = QgsRasterLayer(rfileName, rbaseName)

Now I don't know how to get, for example, for pixel (1,1) its coordinates (X,Y) and its RGB color values.

Anybody could help me?

I know that I'll need to implement a DO WHILE, but I don't know the commands to extract this information of each pixel.

Thanks in advance, Mateus

2
  • (1) What do you consider the coordinates of a pixel? Its center point, the boundary extent or corner points? (2) Have a look at numpy and gdal in python and also at the ValueTool plugin in qgis. This pretty much does what you want and all you need is to write a loop around it. Although I don't really see your goal of acquiring cell coordinates?
    – Curlew
    Commented Mar 24, 2014 at 17:43
  • Hi Curlew, Thanks for your support. I solved the issue using GDAL. Best regards!
    – mbonad
    Commented Mar 26, 2014 at 12:43

3 Answers 3

5

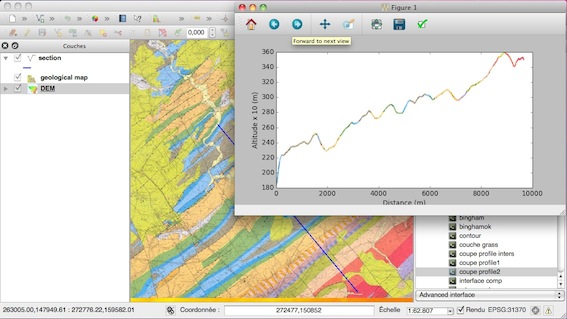
As a geologist, I make geological cross section using the elevations values from a DEM and the colors from a geological map, look at the pure Python solution with osgeo.gdal in Python Script for getting elevation difference between two points

But now, since PyQGIS 2.x, it is easier with PyQGIS and the QgsRaster.IdentifyFormatValuefunction

  • example with a DEM (one band):

    myDEM = qgis.utils.iface.activeLayer()  
    print myDEM.bandCount()  
    1   
    print myDEM.dataProvider().identify(QgsPoint(229774,111171), QgsRaster.IdentifyFormatValue)  
    {1: 221.0}
    
  • example with a classic raster (three bands -> R,G,B values):

     print myraster.dataProvider().identify(QgsPoint(229774,111171), QgsRaster.IdentifyFormatValue).results()
     {1: 180.0, 2: 142.0, 3: 125.0}
    

The result is a dictionary (key= band number) and you can create a simple function that returns the values:

def val_raster(point,raster):
    return raster.dataProvider().identify(point, QgsRaster.IdentifyFormatValue).results().values()

elevation = val_raster(QgsPoint(229774,111171),myDEM)
print elevation
221.0
R,G,B = val_raster(QgsPoint(229774,111171),myraster)
print R,G,B
180.0, 142.0, 125.0

I presented a complete solution with PyQGIS in French PyQGIS (QGIS 2): geological cross-sections (colorization of a topographic profile build from a DEM with the colors of a raster and placement of the intersection points of the geological layers boundaries )

enter image description here

1
  • Hi Gene, Thanks for your support. I solved the issue using GDAL. Best regards!
    – mbonad
    Commented Mar 26, 2014 at 12:44
2

I don't have enough points to comment so I am posting in answer section.

I came from MATLAB background and always like to have map2pix and pix2map function as giving in mapping toolbox. Using above comments and posted pdf link, I wrote both of them. It might help someone.

After this layer.dataProvider().identify(QgsPoint(x, y), QgsRaster.IdentifyFormatValue) can be used to get appropriate values

def map2Pix(longitude =0,
            latitude =0,
            transform =None):
    """
    converts map coordinates to image pixel [col, row]
    :param longitude:
    :param latitude:
    :param transform:
    :return: xOffset, yOffset
    """
    if transform:
        # compute pixel offset
        xOffset = int((longitude - transform[0]) / transform[1])
        yOffset = int((latitude - transform[3]) / transform[5])
        return xOffset, yOffset

def pix2Map(xOffset =0,
            yOffset =0,
            transform =None):
    """
    converts image pixel [row, col] to map coordinates
    :param xOffset:
    :param yOffset:
    :param transform:
    :return: longitude, latitude
    """
    if transform:
        longitude = transform[0] + transform[1]*xOffset
        latitude = transform[3] + transform[5]*yOffset
        return longitude, latitude
0

The support for accessing raster data via QgsRasterLayer is fairly limited:

http://lists.osgeo.org/pipermail/qgis-developer/2008-September/004790.html

You can access the value of an individual pixel using the identify tool:

x, y = -1.535, 54.634
res = layer.dataProvider().identify(QgsPoint(x, y), QgsRaster.IdentifyFormatValue)
print res.results()

You can access the width, height, extent and coordinate system too:

width = layer.width()
height = layer.height()
extent = layer.extent()
crs = layer.crs()

However, you're probably better off accessing the raster directly using GDAL, for which there are many examples. See this PDF as a general introduction to reading raster data with Python/GDAL: http://www.gis.usu.edu/~chrisg/python/2009/lectures/ospy_slides4.pdf

1
  • Dear all. Thank you for the quick support. I'm glad to solve my issue using GDAL. This library have (so far) the tools I need to work in my project. Best regards!!
    – mbonad
    Commented Mar 26, 2014 at 12:42

Your Answer

By clicking “Post Your Answer”, you agree to our terms of service and acknowledge you have read our privacy policy.

Not the answer you're looking for? Browse other questions tagged or ask your own question.