4

I have a contour generated from SRTM,
enter image description here

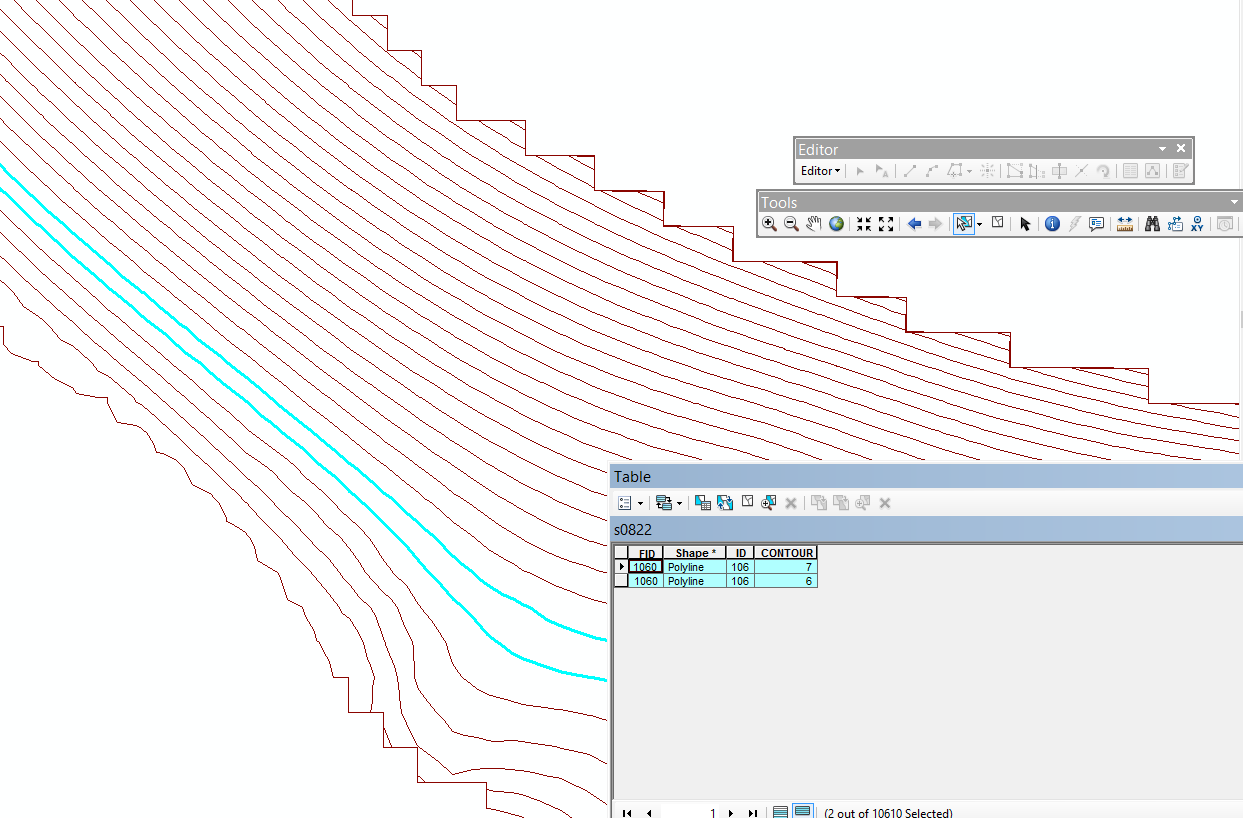
How to fill the space between that contour with polygon (for all part) but it generates field in attribute table automaticaly, example in image above between contour 6 and 7 then the polygon generated should have custom field "nilai" with value "6-7" in attribute table.

I've tried polyline to polygon but it's not working I should enter the value of polygon manually, there are so many to be edited one by one.

1st Method Using Spatial Analyst License (you can zoom in youre browser using "ctrl and +")

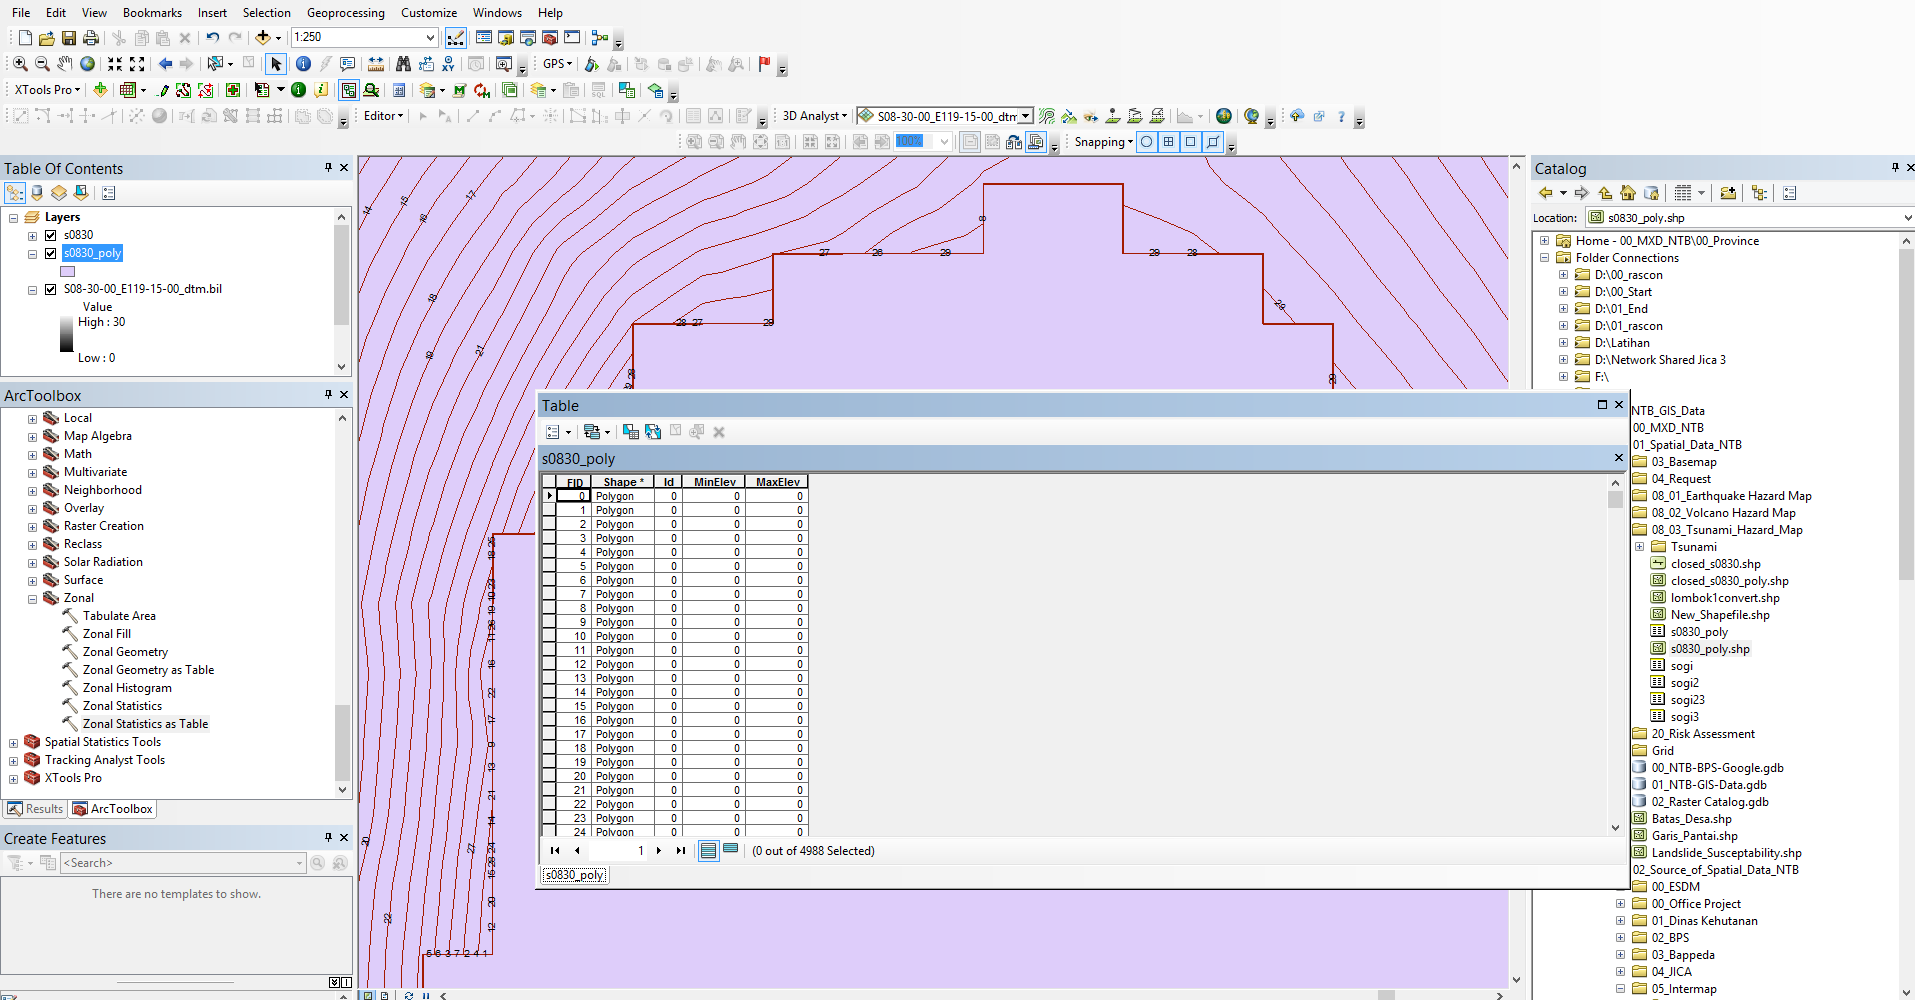
  1. Created Polygon (per 1m for 1m - 30m using feature to polygon tool) from contour created from dtm using contour list tool. https://i.sstatic.net/OdBXL.png enter image description here
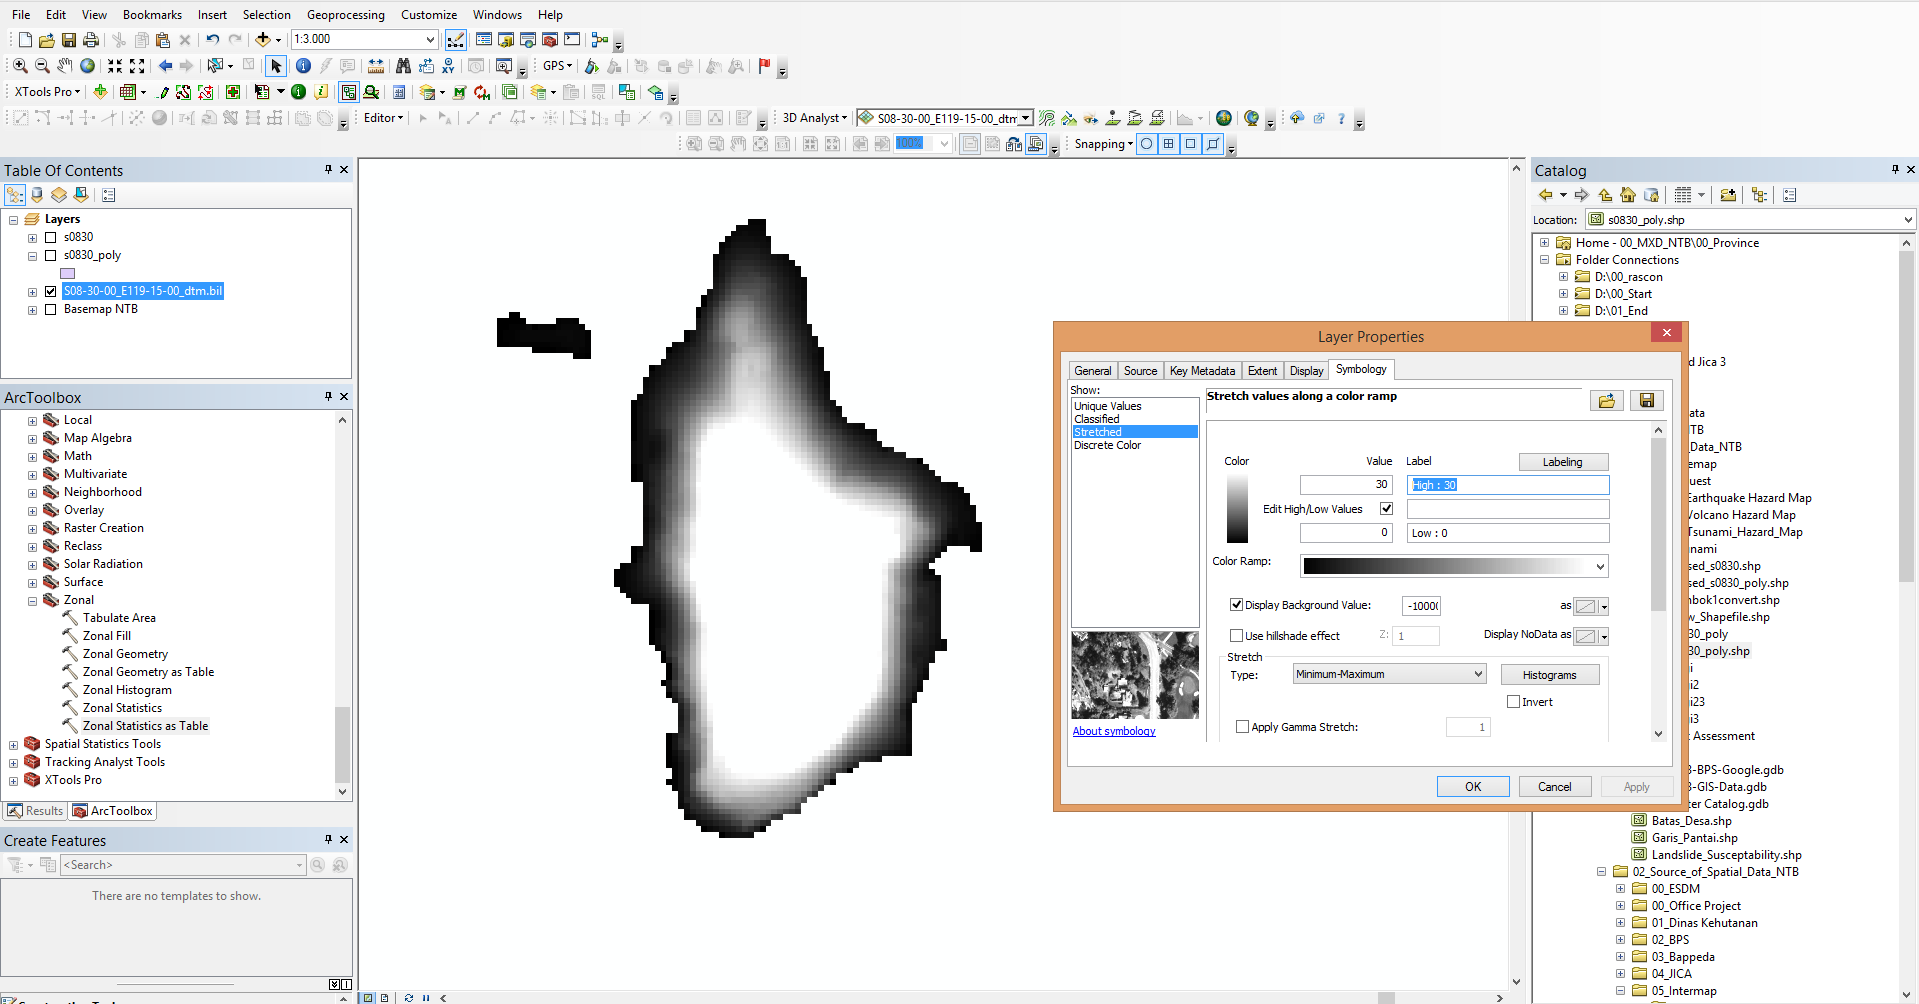
  2. This is my DTM raster https://i.sstatic.net/mez5C.png enter image description here
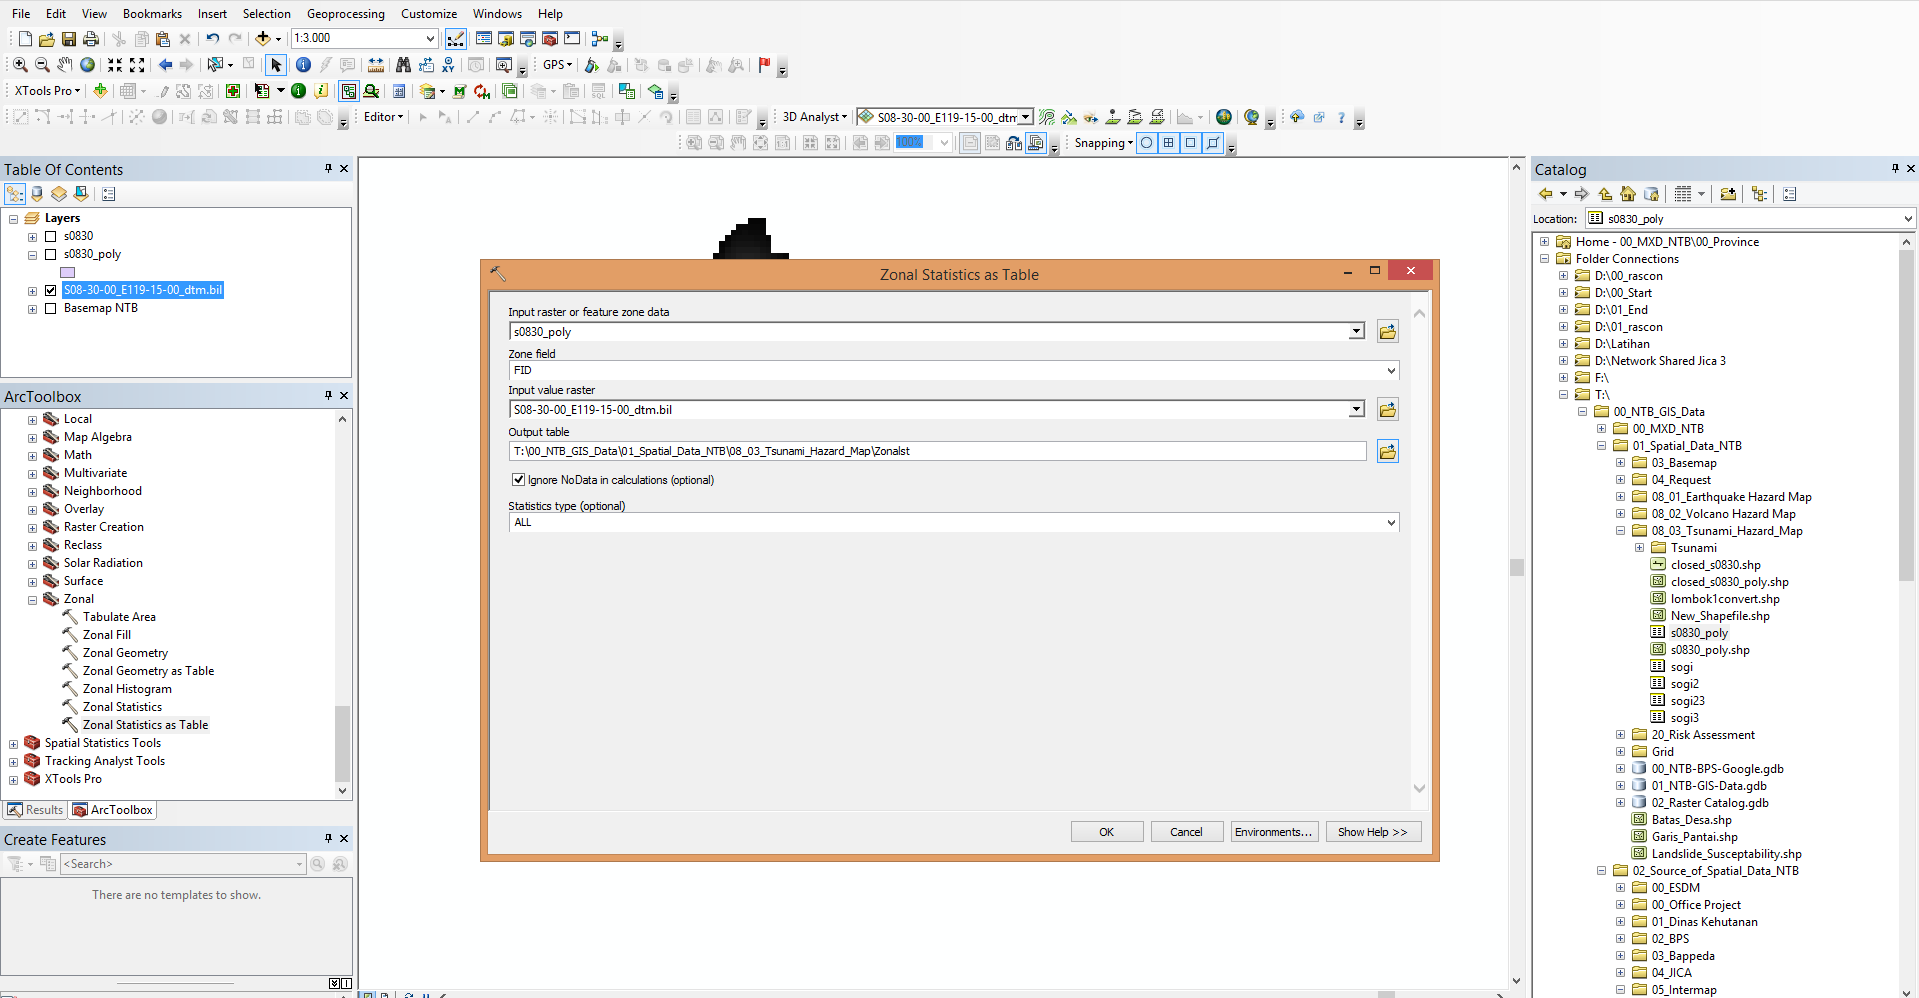
  3. Creating Zonal using Zonal Statistic as Table tool https://i.sstatic.net/ieJlz.png enter image description here
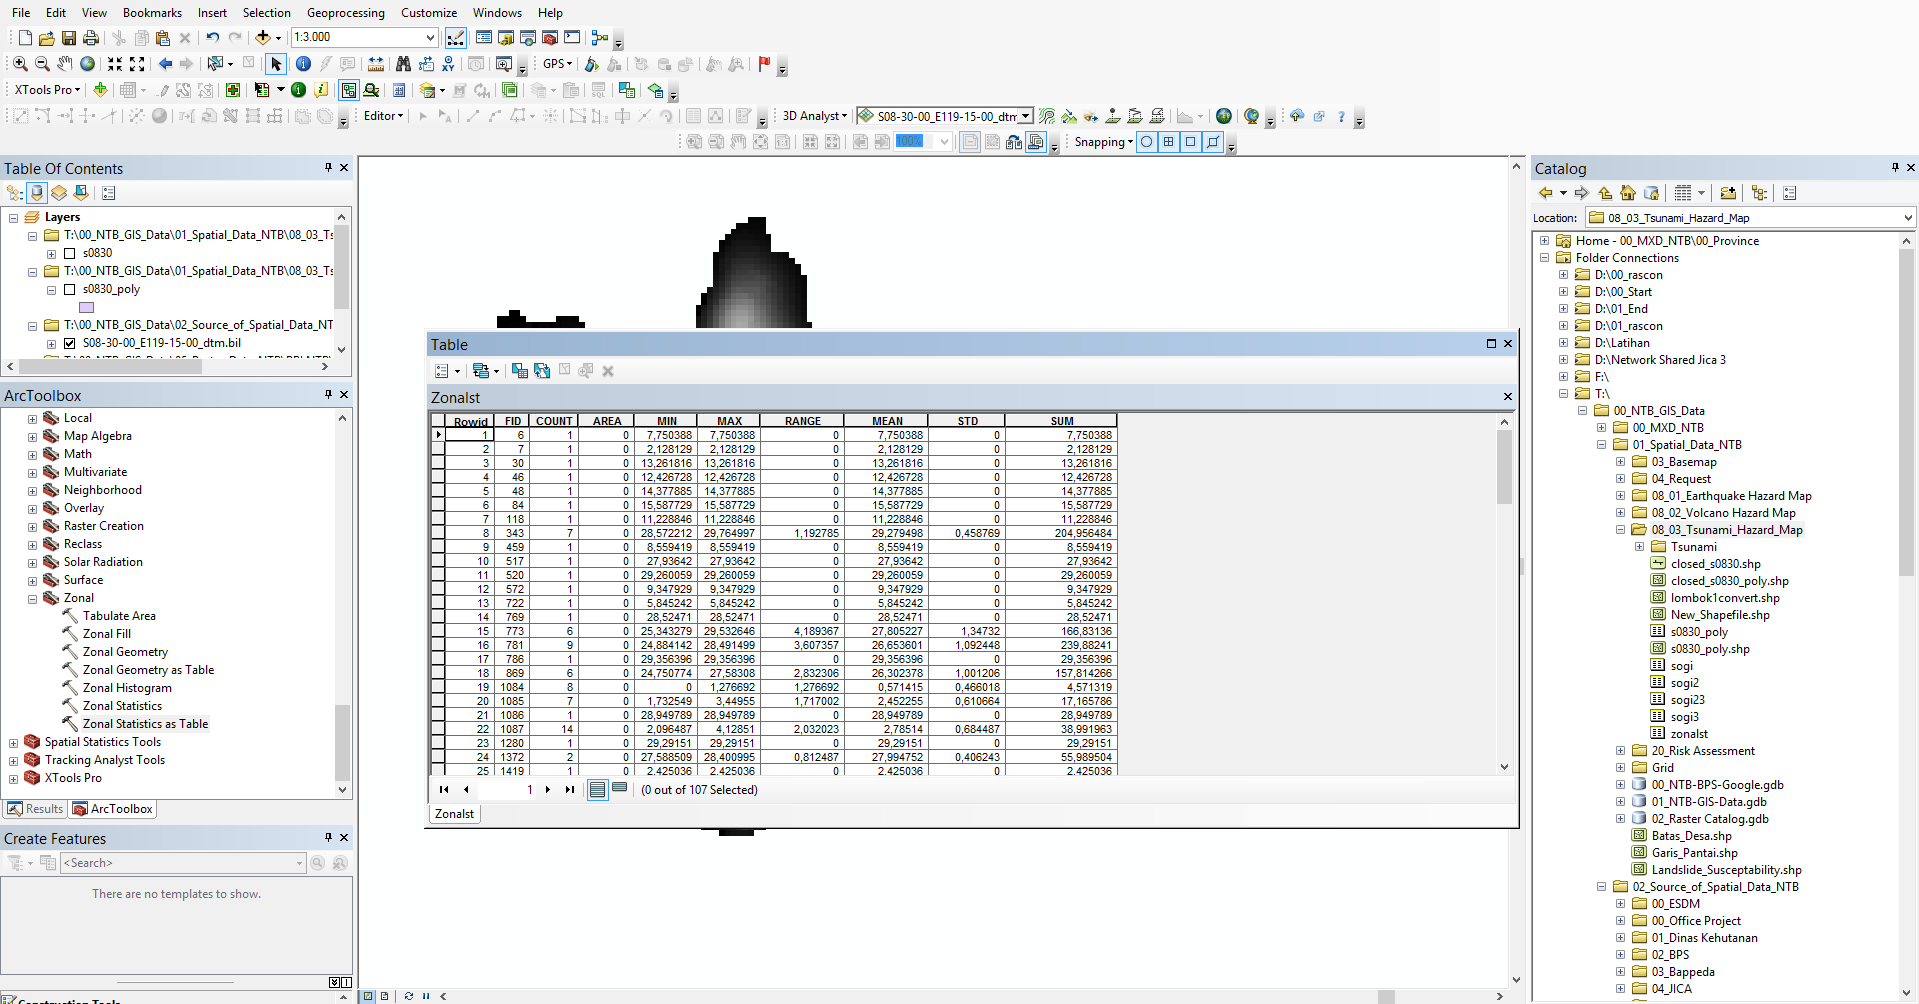
  4. Zonal result attribute table https://i.sstatic.net/8w8iG.png enter image description here
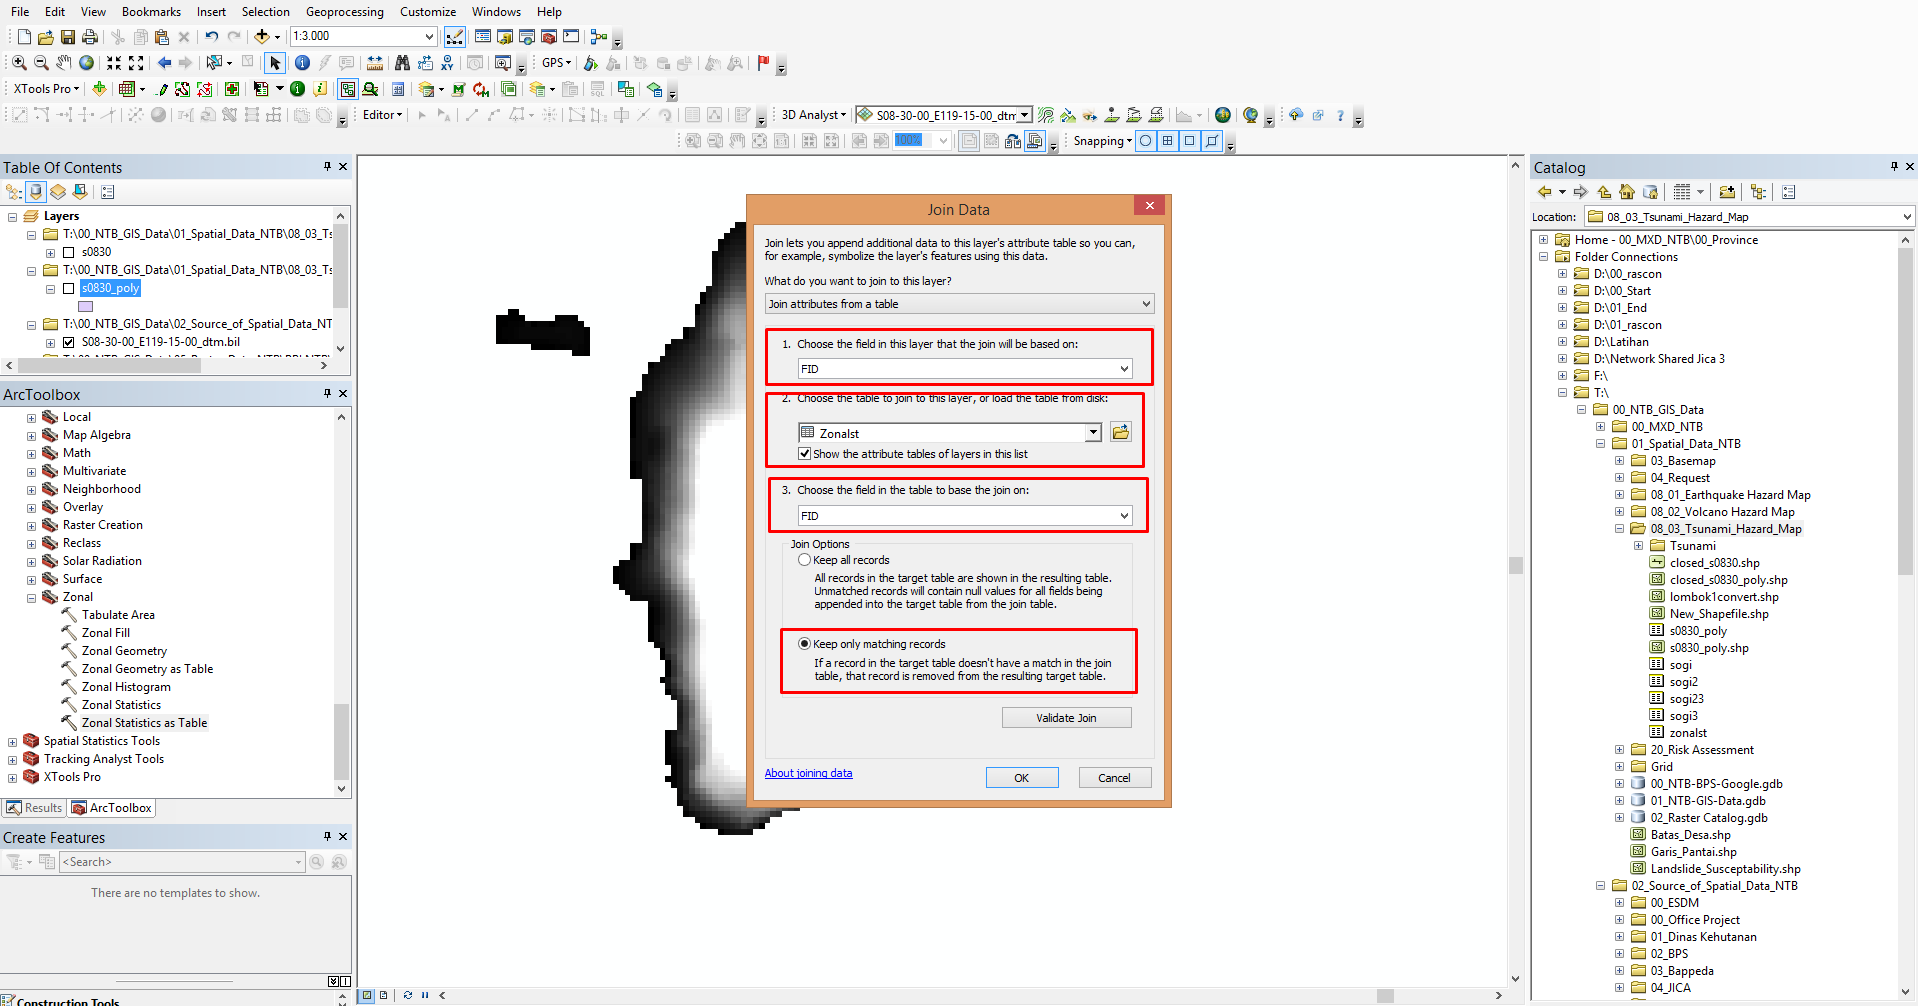
  5. Join polygon with zonal result https://i.sstatic.net/LDhA6.png enter image description here
  6. Attribute Table of joined result https://i.sstatic.net/b8Ve5.png enter image description here
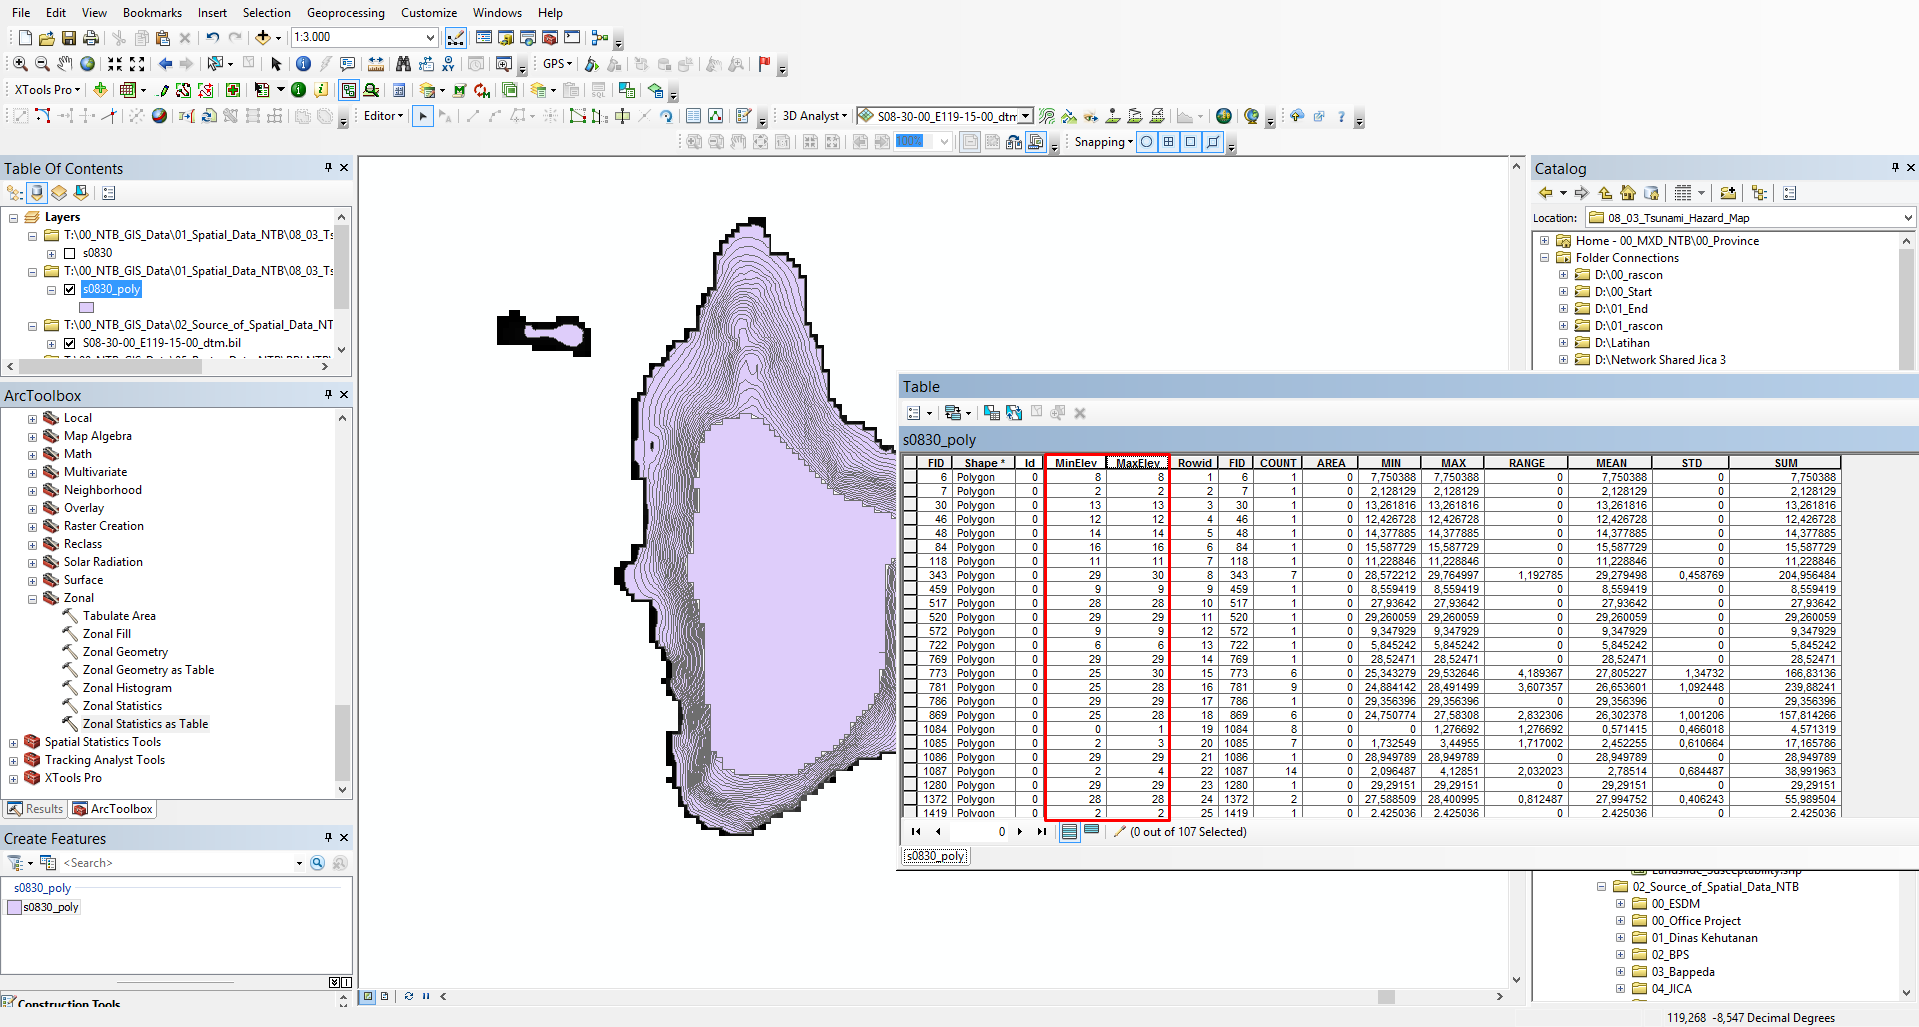
  7. Checking the result after i round it, from that result maximum and minimum value are not match with the contour line https://i.sstatic.net/94Gdb.png enter image description here
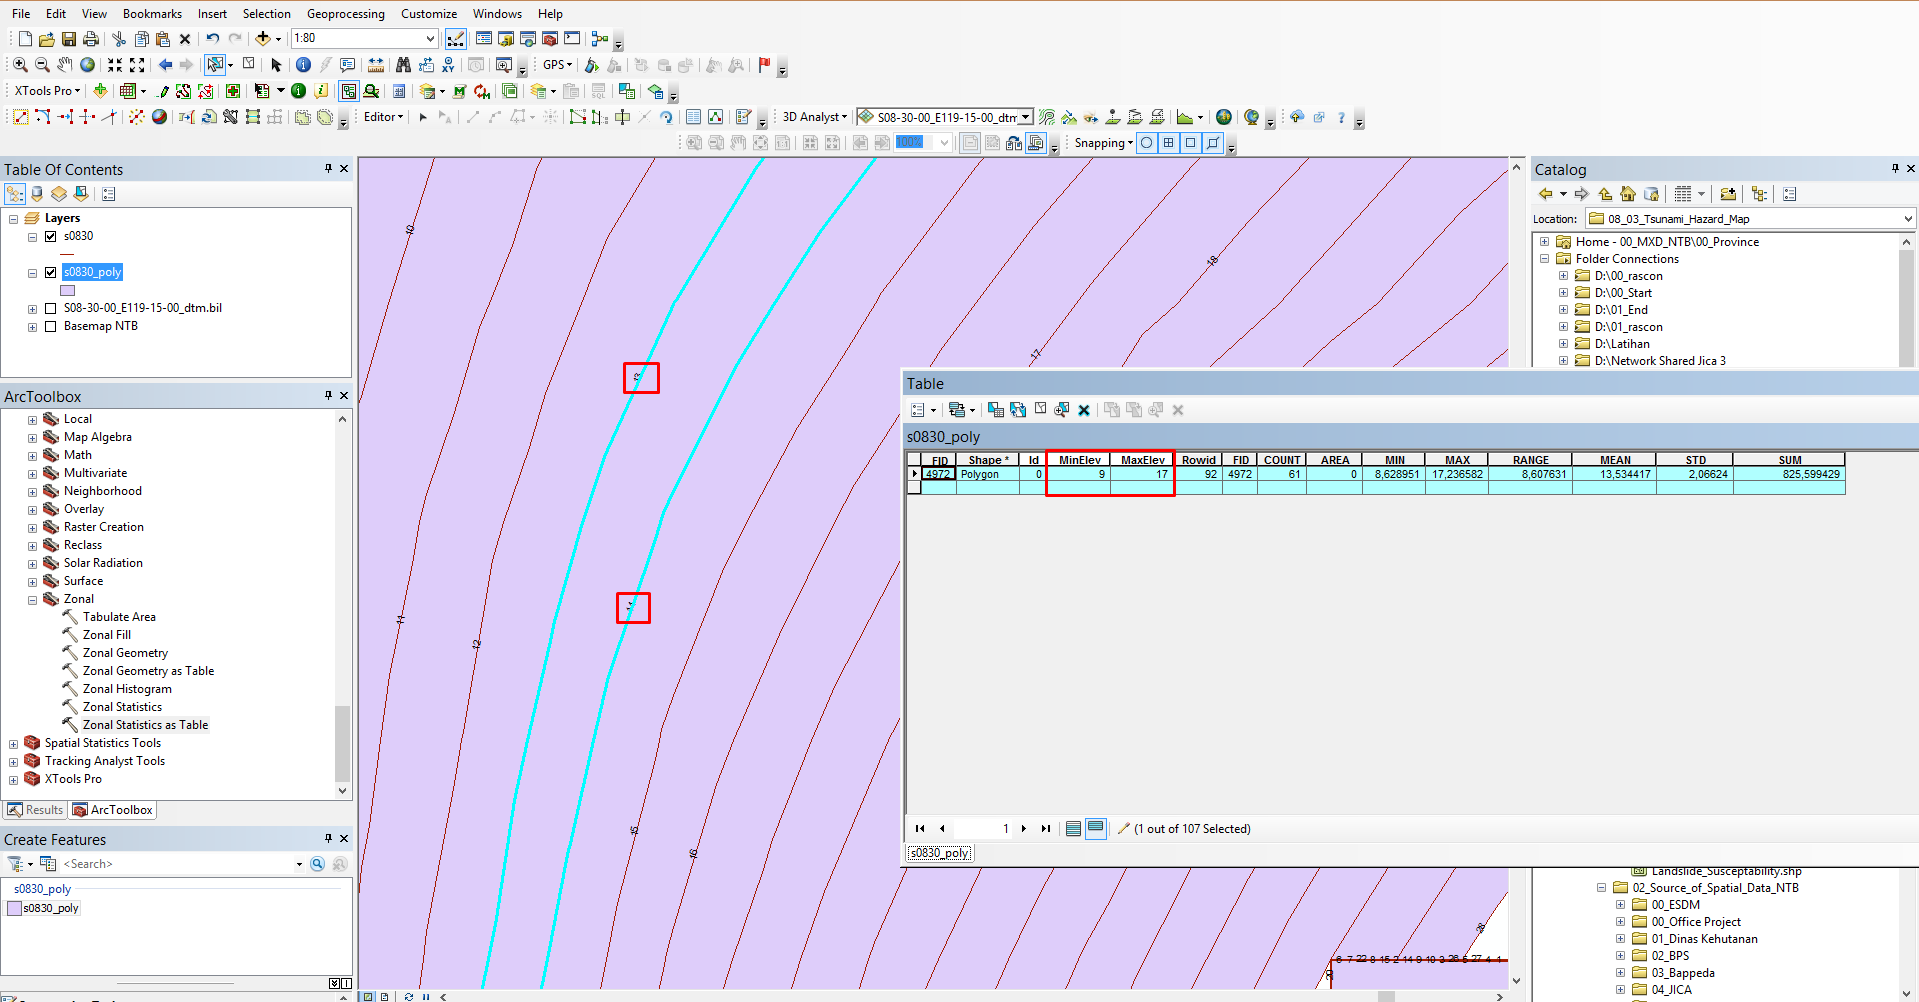
2nd Method Using Spatial Analyst License I use this script provide by Michael

import sys, os, arcpy

InPolygons = sys.argv[1]
NearContour = sys.argv[2]
OutPolygons = sys.argv[3]

ElevationFieldName = "contour" # change this to match your field name

InFolder = os.path.dirname(InPolygons) # the folder the input is in
Working = InFolder + "\\Working.gdb"
WorkingContour = Working+"\\Contour"
WorkingPoly = Working+"\\Poly"

arcpy.CreateFileGDB_management(InFolder,"Working.gdb") # create a working space
arcpy.AddMessage("Copy 1")
arcpy.CopyFeatures_management(NearContour,WorkingContour) # need to do this to take charge of names
arcpy.AddMessage("Copy 2")
arcpy.CopyFeatures_management(InPolygons,WorkingPoly) 

# remove 'bad' edges, tagged with elevation = -9999 to show they are a boundary
arcpy.MakeFeatureLayer_management(WorkingContour,"Remove",ElevationFieldName + " = -9999")
arcpy.DeleteFeatures_management("Remove")
arcpy.Delete_management("Remove") # relax, it's just removing the layer, just to keep it clean

# Create a near table
arcpy.AddMessage("Near table")
arcpy.GenerateNearTable_analysis(WorkingPoly,WorkingContour,Working+"\\NearTable","0",closest="ALL")
arcpy.AddField_management(Working+"\\NearTable","Elev","DOUBLE")

try:
    arcpy.AddIndex_management(Working+"\\NearTable","NEAR_FID","NEAR_FID")
except:
    arcpy.AddWarning("Unable to index")

# join and copy elevations
arcpy.AddMessage("Join & calc")
arcpy.MakeTableView_management(Working+"\\NearTable","View")
arcpy.AddJoin_management("View","NEAR_FID",WorkingContour,"OBJECTID")
arcpy.CalculateField_management("View","NearTable.Elev","!Contour."+ElevationFieldName+"!","PYTHON")
arcpy.Delete_management("View") # relax, it's just removing the table view, just to keep it clean

# remove join and summary statistics
arcpy.AddMessage("Make stats")
#arcpy.RemoveJoin_management("View")
arcpy.Statistics_analysis(Working+"\\NearTable",Working+"\\NearStats",[["Elev","MIN"],["Elev","Max"]],"IN_FID")

# copy the min and max to the working contours
arcpy.AddMessage("Copy min/max")
arcpy.AddField_management(WorkingPoly,"MinElev","DOUBLE")
arcpy.AddField_management(WorkingPoly,"MaxElev","DOUBLE")
arcpy.MakeFeatureLayer_management(WorkingPoly,"Layer")
arcpy.AddJoin_management("Layer","OBJECTID",Working+"\\NearStats","IN_FID")
arcpy.CalculateField_management("Layer","Poly.MinElev","!NearStats.Min_Elev!","PYTHON")
arcpy.CalculateField_management("Layer","Poly.MaxElev","!NearStats.Max_Elev!","PYTHON")
arcpy.RemoveJoin_management("Layer")
arcpy.Delete_management("Layer") # relax, it's just removing the layer, just to keep it clean

# check for field
arcpy.AddMessage("Checking for field")
Fields = arcpy.ListFields(WorkingPoly,"nilai")
if not Fields:
    arcpy.AddMessage("-Adding field")
    arcpy.AddField_management(WorkingPoly,"nilai","TEXT",field_length="10")

# format the field with the min and max,
# this could be done with a field calculation
# but in this case I want a special case for isolations
arcpy.AddMessage("Cursoring")
with arcpy.da.UpdateCursor(WorkingPoly,("nilai","MinElev","MaxElev")) as UpCur:
    for Feat in UpCur:
        if (Feat[1]==Feat[2]):
            # values are the same = an isolation
            Feat[0] = str(int(Feat[1]))
        else:
            Feat[0] = "%d - %d" % (Feat[1],Feat[2])
        UpCur.updateRow(Feat)

arcpy.AddMessage("Copy out")
arcpy.CopyFeatures_management(WorkingPoly,OutPolygons) 

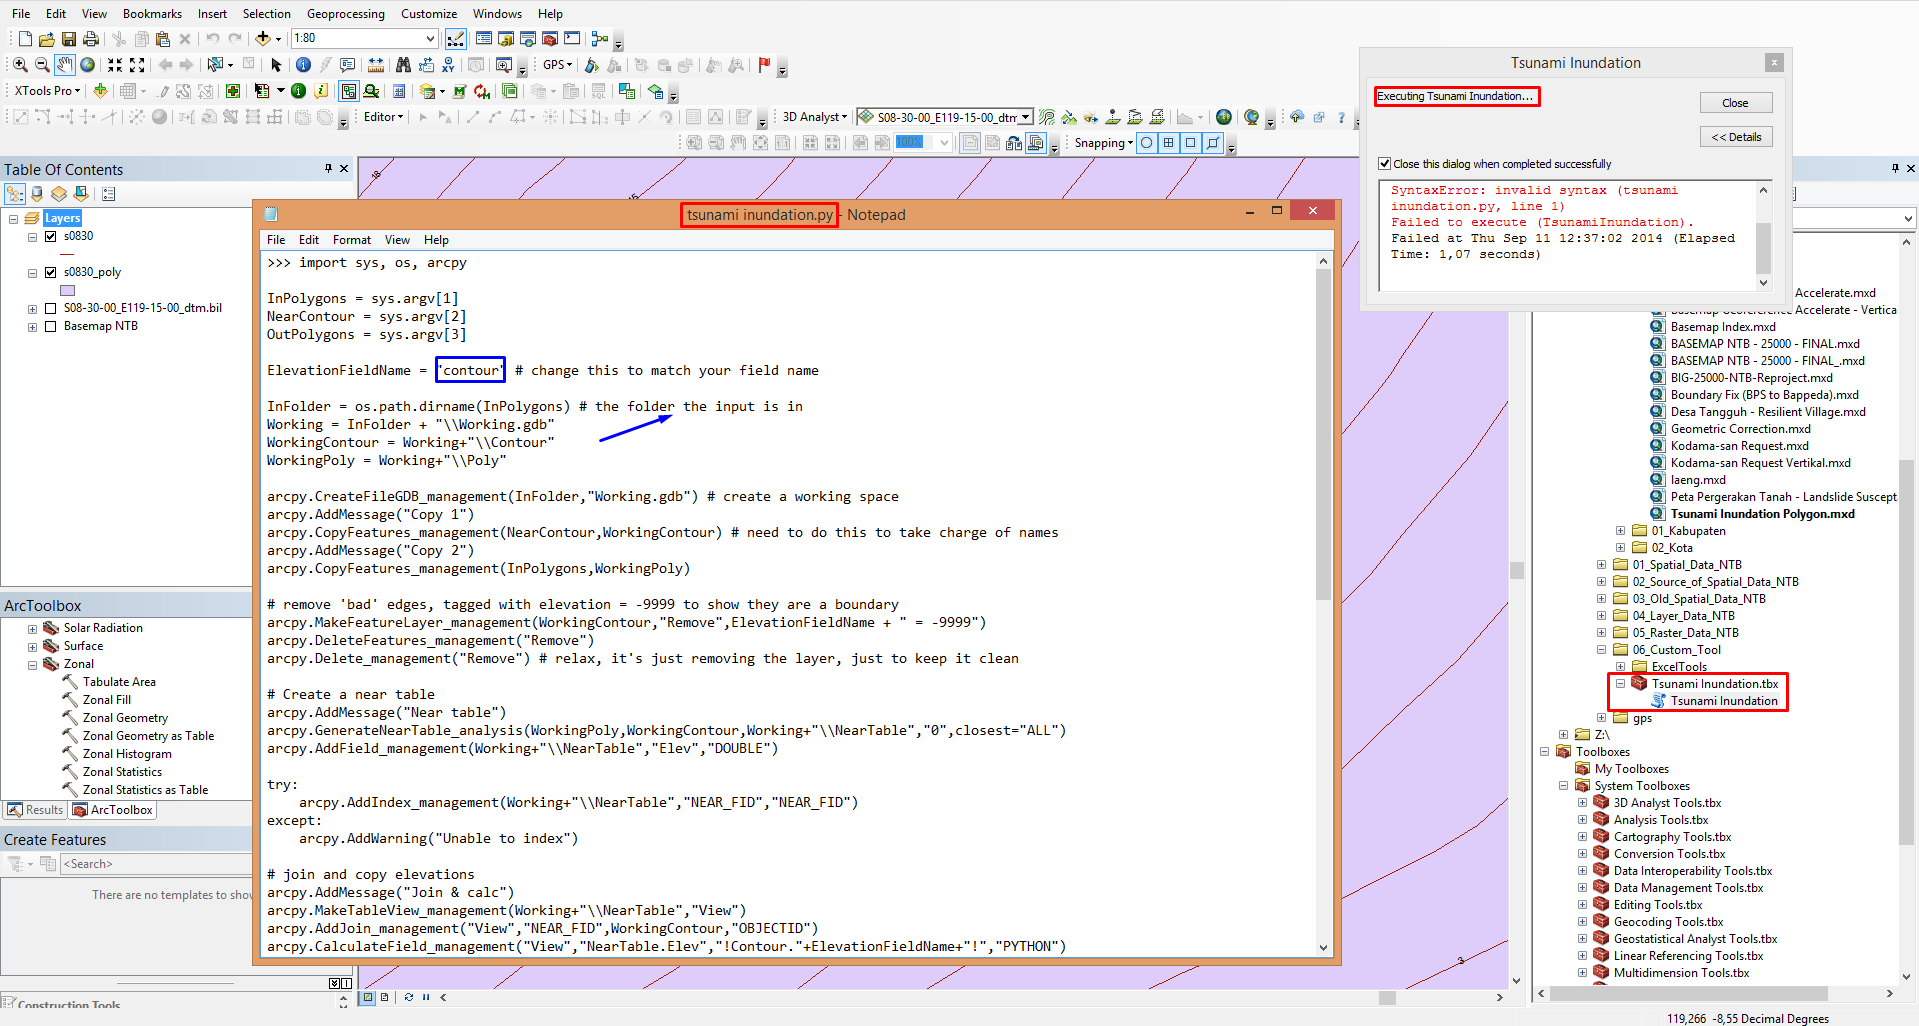
Processing : enter image description here
Result https://i.sstatic.net/jF21X.png enter image description here
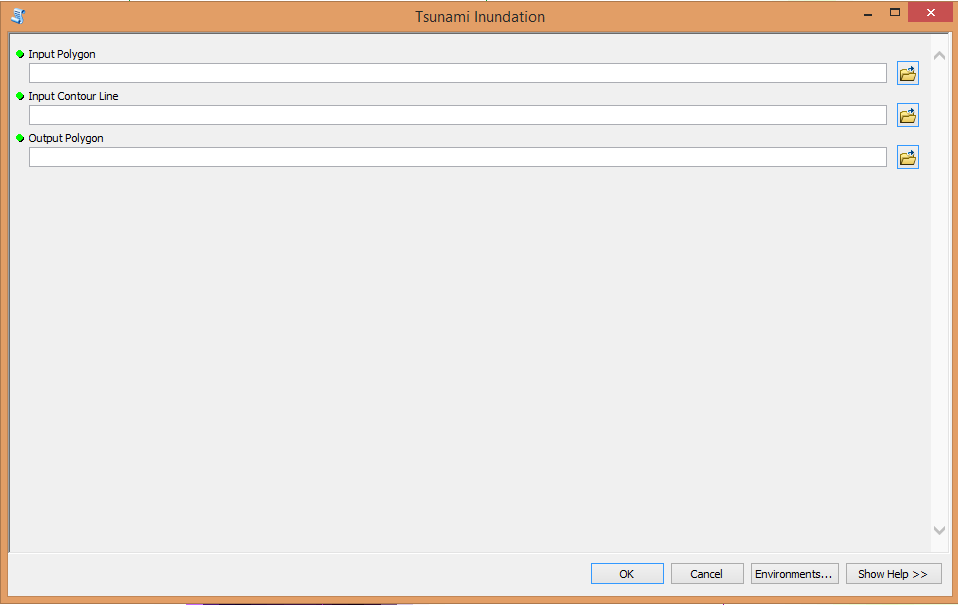
I use 2nd Method, it takes a long time but it work. Thanks.

12
  • cover with a bounding box and use feature to polygon to make the polygons and then you just need to find the bounding line information, this could be done in a python script. Commented Sep 9, 2014 at 1:17
  • Thanks, so what should i do is I convert first with feature to polygon tool (I get it until here) but the next problem is (as you know before) I'm bad at python... any clue? Commented Sep 9, 2014 at 1:20
  • Yes, I know how to do it but it will take a long time. You need to select by location (contours bounding each polygon) and then find out which one is lower and if you have any higher ignoring the bounding box (summary statistics can do this) and then calculate the values. It's not difficult just tedious. Commented Sep 9, 2014 at 1:27
  • I wrote a program to do this in AML and ported it to VB.net; the area between contours are hypsometric areas and they can be shaded as hypsometric tints but only if you know the elevation... anyway, coverages have excellent topology if you can find a way to generate one it's easy to cursor through but still quite tedious. Commented Sep 9, 2014 at 1:37
  • 1
    I think this may be a possible duplicate of gis.stackexchange.com/questions/61550/…
    – PolyGeo
    Commented Sep 9, 2014 at 2:00

1 Answer 1

9

Assuming you've created the polygons by closing the ends (closing lines are given elevation of -9999 so they're removed and not factored into the min and max) and using Feature to Polygon then added your field (nilai as text):

import sys, os, arcpy

InPolygons = sys.argv[1]
NearContour = sys.argv[2]
OutPolygons = sys.argv[3]

ElevationFieldName = "Elevation" # change this to match your field name

InFolder = os.path.dirname(InPolygons) # the folder the input is in
Working = InFolder + "\\Working.gdb"
WorkingContour = Working+"\\Contour"
WorkingPoly = Working+"\\Poly"

arcpy.CreateFileGDB_management(InFolder,"Working.gdb") # create a working space
arcpy.AddMessage("Copy 1")
arcpy.CopyFeatures_management(NearContour,WorkingContour) # need to do this to take charge of names
arcpy.AddMessage("Copy 2")
arcpy.CopyFeatures_management(InPolygons,WorkingPoly) 

# remove 'bad' edges, tagged with elevation = -9999 to show they are a boundary
arcpy.MakeFeatureLayer_management(WorkingContour,"Remove",ElevationFieldName + " = -9999")
arcpy.DeleteFeatures_management("Remove")
arcpy.Delete_management("Remove") # relax, it's just removing the layer, just to keep it clean

# Create a near table
arcpy.AddMessage("Near table")
arcpy.GenerateNearTable_analysis(WorkingPoly,WorkingContour,Working+"\\NearTable","0",closest="ALL")
arcpy.AddField_management(Working+"\\NearTable","Elev","DOUBLE")

try:
    arcpy.AddIndex_management(Working+"\\NearTable","NEAR_FID","NEAR_FID")
except:
    arcpy.AddWarning("Unable to index")

# join and copy elevations
arcpy.AddMessage("Join & calc")
arcpy.MakeTableView_management(Working+"\\NearTable","View")
arcpy.AddJoin_management("View","NEAR_FID",WorkingContour,"OBJECTID")
arcpy.CalculateField_management("View","NearTable.Elev","!Contour."+ElevationFieldName+"!","PYTHON")
arcpy.Delete_management("View") # relax, it's just removing the table view, just to keep it clean

# remove join and summary statistics
arcpy.AddMessage("Make stats")
#arcpy.RemoveJoin_management("View")
arcpy.Statistics_analysis(Working+"\\NearTable",Working+"\\NearStats",[["Elev","MIN"],["Elev","Max"]],"IN_FID")

# copy the min and max to the working contours
arcpy.AddMessage("Copy min/max")
arcpy.AddField_management(WorkingPoly,"MinElev","DOUBLE")
arcpy.AddField_management(WorkingPoly,"MaxElev","DOUBLE")
arcpy.MakeFeatureLayer_management(WorkingPoly,"Layer")
arcpy.AddJoin_management("Layer","OBJECTID",Working+"\\NearStats","IN_FID")
arcpy.CalculateField_management("Layer","Poly.MinElev","!NearStats.Min_Elev!","PYTHON")
arcpy.CalculateField_management("Layer","Poly.MaxElev","!NearStats.Max_Elev!","PYTHON")
arcpy.RemoveJoin_management("Layer")
arcpy.Delete_management("Layer") # relax, it's just removing the layer, just to keep it clean

# check for field
arcpy.AddMessage("Checking for field")
Fields = arcpy.ListFields(WorkingPoly,"nilai")
if not Fields:
    arcpy.AddMessage("-Adding field")
    arcpy.AddField_management(WorkingPoly,"nilai","TEXT",field_length="10")

# format the field with the min and max,
# this could be done with a field calculation
# but in this case I want a special case for isolations
arcpy.AddMessage("Cursoring")
with arcpy.da.UpdateCursor(WorkingPoly,("nilai","MinElev","MaxElev")) as UpCur:
    for Feat in UpCur:
        if (Feat[1]==Feat[2]):
            # values are the same = an isolation
            Feat[0] = str(int(Feat[1]))
        else:
            Feat[0] = "%d - %d" % (Feat[1],Feat[2])
        UpCur.updateRow(Feat)

arcpy.AddMessage("Copy out")
arcpy.CopyFeatures_management(WorkingPoly,OutPolygons) 

Using Generate Near Table with a 0 tolerance to find the link between polygons and their bounding lines. To the near table add a field to store the elevations of the lines they describe, then it's just a matter of getting the statistics for min and max elevations in the near table for each unique input FID (polygon) then joining to the polygons and populating the field.

The tool Generate Near Table will take a very long time to run, so try to do it overnight; I have tested this code with 350 polygons and 345 lines which took about 10 minutes to complete.

Isolations (only one elevation for min and max) will have just their value populated, intermediate polygons will be populated with min - max in that field.

Alternate (Spatial Analyst) method, much faster

If you have a spatial analyst license and the raster the contours came from you can follow the workflow in Colouring areas between (vector) contours? as translated for Esri and performed interactively in ArcMap:

Use the Zonal Statistics as Table tool to create a table using the polygons as input zones and FID (OBJECTID) as the zone field, I used statistics type "ALL" to avoid confusion later. This gives you a table with the raster statistics (min & max) for each polygon - and it's really fast!

Add fields to the polygons for the minimum and maximum elevation and then join the zonal statistics table (join in ArcMap polygon FID to ZonalTable ObjectID_1 or FID_1 depending on table type, either way it should be the second field in the zonal stats table) to your polygon and use the calculation like this:

MinElev = round( !ZonalStatsObjectID.MIN!,0 )
MaxElev = round( !ZonalStatsObjectID.MAX!,0 )

The name of the zonal statistics table in this example is ZonalStatsObjectID, change to match your table name. Do NOT use int( !ZonalStatsObjectID.MIN!), that's a truncation and will give you the wrong value.

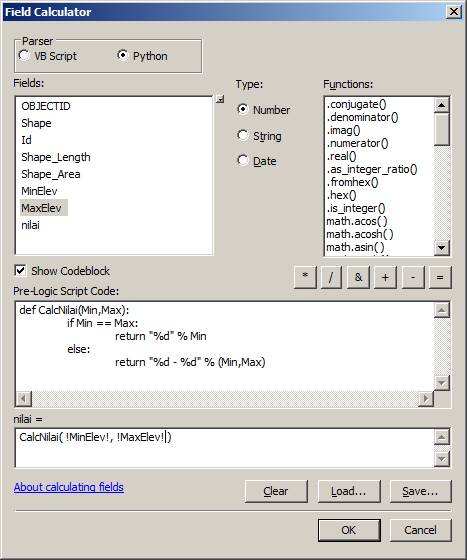
After rounding and copying the values for min and max use field calculator on the table to calculate the nilai field:

def CalcNilai(Min,Max):
    if Min == Max:
        return "%d" % Min
    else:
        return "%d - %d" % (Min,Max)

Which should look like this (I've removed the join for simplicity): enter image description here

16
  • +1 for taking the time to write this out, and for documenting it so well with good comments Commented Sep 9, 2014 at 5:49
  • Thanks @StephenLead, I had already written it and was testing it when PolyGeo commented on the other post. Considering you would need spatial analyst to perform Zonal Statistics (and it was already written) I posted it anyway. The raster method would be much quicker but this works. Commented Sep 9, 2014 at 5:53
  • Actually I have spatial analyst license (but still cant understand the step in gis.stackexchange.com/questions/61550/…, but still this amaze me... It's a complicate code, I'll try first, Thanks for helping me.. again. Commented Sep 9, 2014 at 8:29
  • You're welcome.. again. Have a look at the edits, I've taken the key points from the other post and put them in Esri tools; on the same test data I had it done in under a minute! There is of course a very small chance of getting incorrect value using a raster but it should be good enough. Commented Sep 9, 2014 at 22:21
  • For faster processing I tried the spatial analyst first but it seems the result is not like I expect (I have dtm and contour file). At the edits, I put all my process to do and the result there. If python have less chance getting incorrect value than spatial analyst then I'll use python. can you show me the configurated python for me? I test that python code but I get an error (of course it's my fault, because I haven't configurated it yet) Commented Sep 10, 2014 at 7:00

Your Answer

By clicking “Post Your Answer”, you agree to our terms of service and acknowledge you have read our privacy policy.

Not the answer you're looking for? Browse other questions tagged or ask your own question.