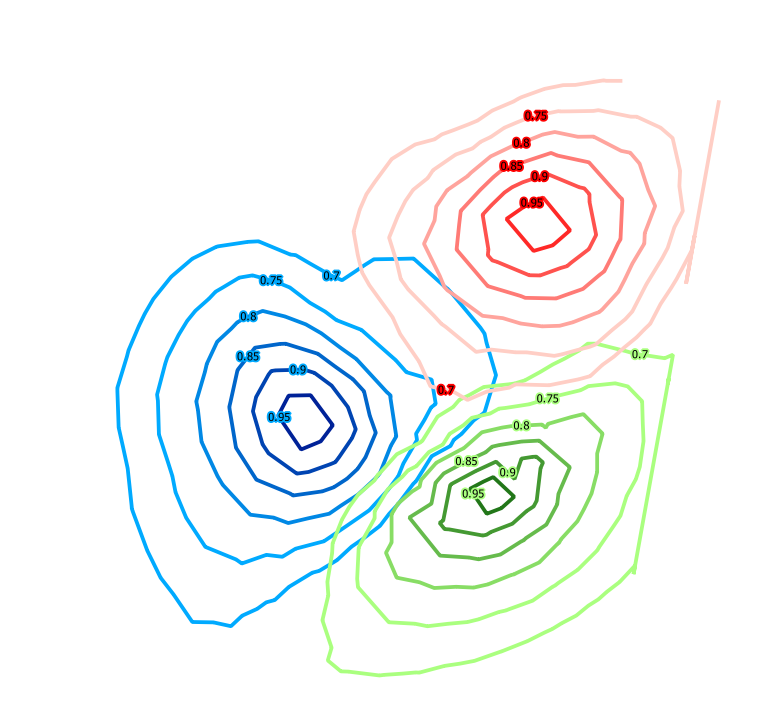
I have a set of gridded data, which I have used to generate contour lines based on separate values in the data.
In the example provided the contour lines shown correlation coefficients. The contours do a good job of interpolating between the grid points to indicate how good the correlation is to any of the three stations.

However, where contour lines overlap it is difficult to tell whether the correlation is stronger towards the blue or the red station. I would like to merge my contour lines together so that it is easy to tell which station has the best correlation for any given spot on the map.
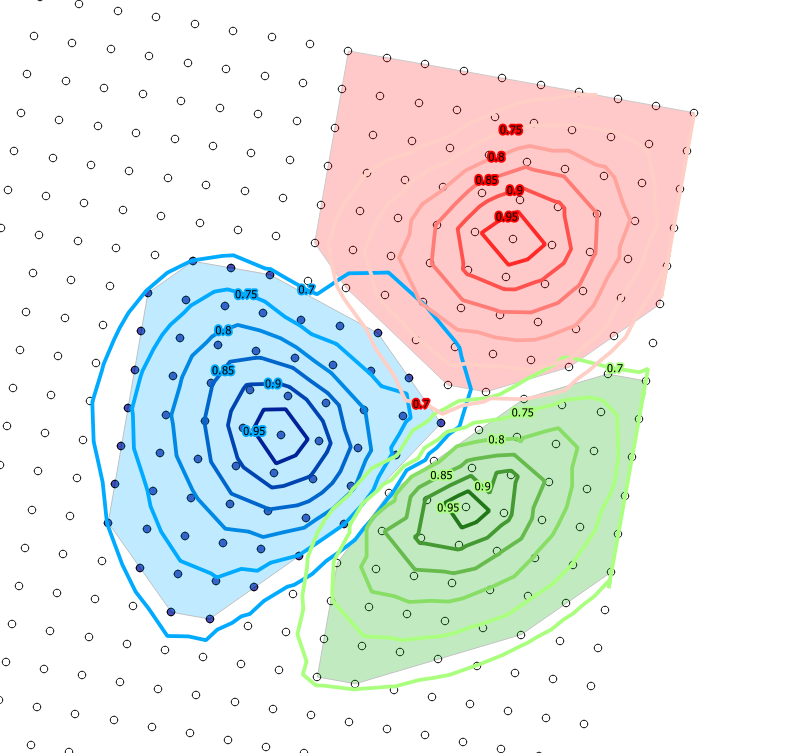
Using the gridded data I sorted by the strongest correlation and created a convex hull around each as shown below. However, this doesn't interpolate between the points like the contours do. 
Is there a way to merge my contours together to create a smooth boundary and show where the highest correlation occurs for each?
