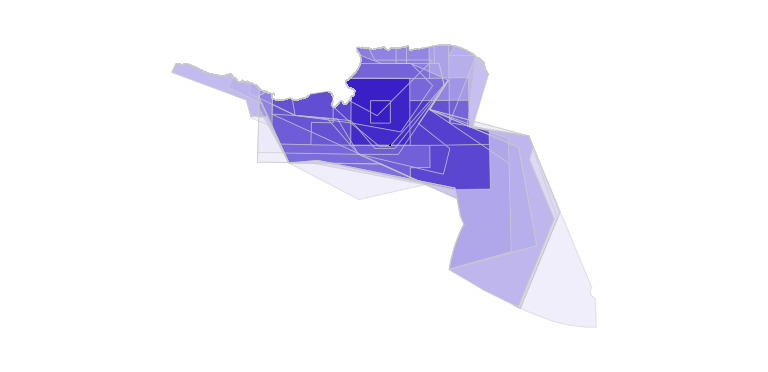
I am trying to plot a geological map using the spplot function in R. For every unit I already assigned a specific color in the col-column of the SpatialPolygonsDataFrame. Now I would like to plot the polygons from the shapefile filling the polygons with the colours according to col-column.
Example Data based on How do I change the polygon fill color and border color for SpatialPolygons objects?
# create data.frame
df <- data.frame(GEOLOGY = c("Quarternary","Tertiary"), col = c("yellow","green"))
# create polygons
Srs1 = Polygons(list(Polygon(cbind(c(2,4,4,1,2),c(2,3,5,4,2)))), "1")
Srs2 = Polygons(list(Polygon(cbind(c(5,4,2,5),c(2,3,2,2)))), "2")
# create spdf
SpDF <- SpatialPolygonsDataFrame( SpatialPolygons(list(Srs1,Srs2)),  df )
# plot spdf
spplot(SpDF, zcol = "GEOLOGY", col.regions = "col")
which results in
Error in .local(obj, ...) : length of col.regions should match number of factor levels
I also tried:
spplot(SpDF, zcol = "GEOLOGY", col.regions = SpDF$col)
which plots the spdf but with wrong colours - red and black?
Any ideas how to plot the correct colours in the correct polygons?
@cengel's suggestion works fine.
After that I added 1 more polygon to my map
df <- data.frame(GEOLOGY = c("Quarternary","Tertiary","Quarternary"), col =  c("yellow","green","yellow"))

Srs1 = Polygons(list(Polygon(cbind(c(2,4,4,1,2),c(2,3,5,4,2)))), "1")
Srs2 = Polygons(list(Polygon(cbind(c(5,4,2,5),c(2,3,2,2)))), "2")
Srs3 = Polygons( list (Polygon(  cbind( c(5,5,4.5,5), c(2,3,2.5,2) ))), "3")

SpDF <- SpatialPolygonsDataFrame( SpatialPolygons(list(Srs1,Srs2, Srs3)), df )
## plot with labels for polygons
spplot(SpDF, zcol = "GEOLOGY", col.regions = as.vector(SpDF$col),
   sp.layout = list(
    list("sp.text", loc = coordinates(SpDF)[1,], txt = SpDF$GEOLOGY[1],cex=0.6),
    list("sp.text", loc = coordinates(SpDF)[2,], txt = SpDF$GEOLOGY[2],cex=0.6),
    list("sp.text", loc = coordinates(SpDF)[3,], txt = SpDF$GEOLOGY[3],cex=0.6)))
removed the typo. Now the Quarterary polgons get a green fill and the Tertiary polygon and yellow fill colour which is not according to the data.frame. It seems to pure coincidence if the colours match?

