15

I am looking for a method to process a remote sensing image and extract the crown areas of the individual trees from the image.

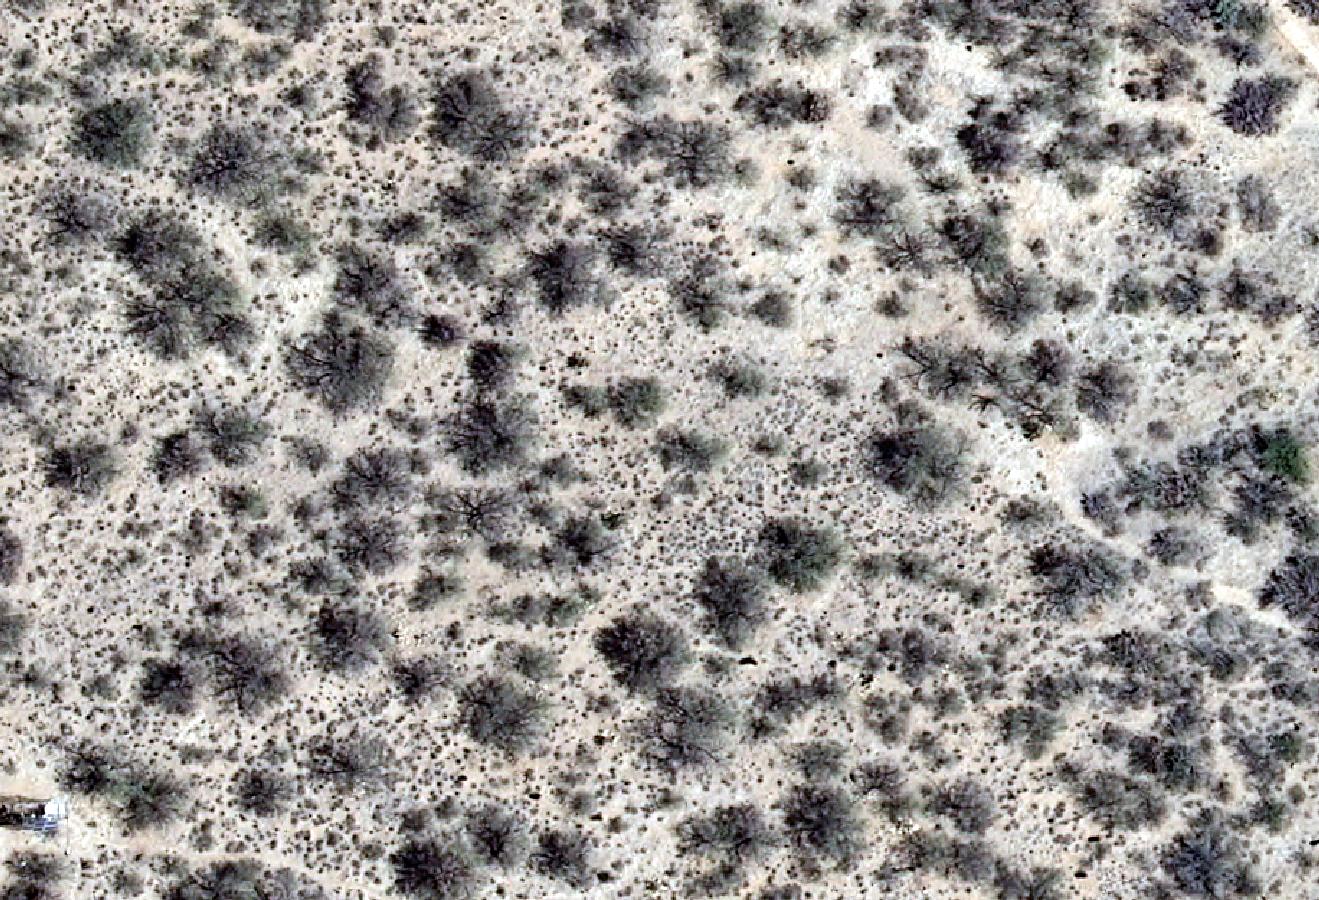
I have both visual wavelength areal imagery, and lidar data from the area. The location in question is a desert area, so the tree cover isn't as dense as a forest area. The resolution of the aerial imagery is 0.5 feet by 0.5 feet. The lidar resolution is approximately 1 x 1 feet. Both the visual data and the lidar come from a Pima County, Arizona dataset. A sample of the type of aerial imagery I have is at the end of this post.

This question Single Tree detection in ArcMap? seems to be the same issue, but there does not seem to be a good answer there.

I can obtain a reasonable classification of the vegetation types (and information about the overall percent cover) in the area by using the Iso Cluster classification in Arcmap, but this provides little information on individual trees. The closest I have to what I want is the results of passing the output of the isocluster classification through the Raster to Polygon feature in Arcmap. The problem is that this method merges near by trees into a single polygon.

Edit: I probably should have included some more detail about what I have. The raw datasets I have are:

  • Full las data, and a tiff raster generated from it.
  • Visual imagery (like the sample image shown, but covering a much wider area)
  • Manual direct measurements of a subset of the trees in the area.

From these I have generated:

  1. The ground/vegetation classifications.
  2. The DEM/DSM rasters.

sample aerial imagery

7
  • You've got more data than the link. Do you have the classified las files or just the DEM/DSM raster (which one?)? It's really not easy to do this with just visual wavelengths with any degree of accuracy. Commented Dec 3, 2014 at 2:41
  • I probably should have included some more detail about what I have. The raw datasets I have are: 1.Full las data, and a tiff raster generated from it 2. Visual imagery (like the sample image shown, but covering a much wider area) 3. manual direct measurements of a subset of the trees in the area. From these I have generated: 1. the ground/vegetation classifications 2. the DEM/DSM rasters Commented Dec 3, 2014 at 7:48
  • Do you have access to eCognition? If not, what image processing software or programming languages do you have access to or know?
    – Aaron
    Commented Dec 3, 2014 at 21:19
  • I don't have a copy of eCognition, but I'll check if anyone I know in my lab/university has it because it seems popular for this type of thing. I'm knowledgeable in Python, C and Java. I have a copy of Matlab but I'm pretty much a noob at it. I have access to any of the software on this list softwarelicense.arizona.edu/students , plus, of course ArcGIS. Commented Dec 4, 2014 at 7:38
  • A bit more detail in the commercial applications I have. Some of the ones on that list of software I linked are Matlab, Mathematica, JMP and other statistics tools, and software development tools such as Visual Studio. Commented Dec 4, 2014 at 8:02

5 Answers 5

11

There is a considerable body of literature on individual crown detection in spectral and lidar data. Methods wise, perhaps start with:

Falkowski, M.J., A.M.S. Smith, P.E. Gessler, A.T. Hudak, L.A. Vierling and J.S. Evans. (2008). The influence of conifer forest canopy cover on the accuracy of two individual tree measurement algorithms using lidar data. Canadian Journal of Remote Sensing 34(2):338-350.

Smith A.M.S., E.K. Strand, C.M. Steele, D.B. Hann, S.R. Garrity, M.J. Falkowski, J.S. Evans (2008) Production of vegetation spatial-structure maps by per-object analysis of juniper encroachment in multi-temporal aerial photographs. Canadian Journal Remote Sensing 34(2):268-285

If you are interested in the Wavelet method (Smith et al., 2008), I have it coded in Python but, it is very slow. If you have Matlab experience, this is where it is implemented in production mode. We have two papers where we identified ~6 million acres of juniper encroachment in eastern Oregon using the wavelet method with NAIP RGB-NIR imagery so, it is well proven.

Baruch-Mordo, S., J.S. Evans, J. Severson, J. D. Naugle, J. Kiesecker, J. Maestas, and M.J. Falkowski (2013) Saving sage-grouse from the trees: A proactive solution to reducing a key threat to a candidate species Biological Conservation 167:233-241

Poznanovic, A.J., M.J. Falkowski, A.L. Maclean, and J.S. Evans (2014) An Accuracy Assessment of Tree Detection Algorithms in Juniper Woodlands. Photogrammetric Engineering & Remote Sensing 80(5):627–637

There are some interesting approaches, in general object decomposition, from the applied mathematics state space literature using multiresolution Gaussian processes to decompose object characteristics across scale. I use these types of models to describe multi-scale process in ecological models but it could be adapted to decompose image object characteristics. Fun, but a bit esoteric.

Gramacy, R.B., and H.K.H. Lee (2008) Bayesian treed Gaussian process models with an application to computer modeling. Journal of the American Statistical Association, 103(483):1119–1130

Kim, H.M., B.K. Mallick, and C.C. Holmes (2005) Analyzing nonstationary spatial data using piecewise Gaussian processes. Journal of the American Statistical Association, 100(470):653–668

7
  • +1 Especially for option 4; Since the OP has lidar data, it would be worth running the wavelet method on a canopy surface model. Although, as you know, the wavelet method is not really mainstream yet (or maybe ever).
    – Aaron
    Commented Dec 3, 2014 at 21:42
  • In an ode to the one-size-fits-all ideal, I am going to start referring to commercial software (eg., ESRI, ERDAS) as Big-box software. Often the best solution, or any at all, is not available in "Big-box software". Often one has to look towards the development or academic communities for answers to complex spatial analytical problems. This takes you out of the mainstream in a big hurry. Fortunately, these communities like to share. This is also why it is important for an analyst to not rely on push-button solutions. Commented Dec 3, 2014 at 22:22
  • 2
    I tend to agree about BBS for complex spatial problems. However, extracting a single type of vegetation in an arid environment--especially if you have access to lidar data--is pretty mainstream. In this case, there is no need to re-invent the wheel by developing a new approach to simple tree identification. My thoughts are why not use a pre-established, push-button approach, especially in a package like eCognition, which is highly suited for automation?
    – Aaron
    Commented Dec 3, 2014 at 23:05
  • 1
    I should add that eCognition has the capacity for individual crown ID. As an example, you can find a sample ruleset at the eCog community that uses a seed growing approach--search for "Oil Palm Tree Delineation sample Rule Set". Integrating eCog's new template matching algorithm and this seed growing approach could potentially be a very powerful method.
    – Aaron
    Commented Dec 23, 2014 at 17:08
  • 1
    I am interested in the python code you mention for the Smith (2008) Wavelet method. Is it available anywhere?
    – Alpheus
    Commented Apr 29, 2016 at 20:12
3

To create a DHM subtract the DEM from the DEM, this can be done in Esri Raster Calculator or GDAL_CALC. This will put all your elevations on a 'level playing field'.

Syntax (Substitute full paths for DEM, DSM & DHM):

GDAL_CALC.py -A DSM -B DEM --outfile=DHM --CALC "A-B"

The DHM will be mostly 0 (or near enough), which you make your nodata value. With Raster Calculator or GDAL_CALC you can extract values more than an arbitrary value based on the amount of noise you observe in the DHM. The object of this is to reduce noise and highlight just the crowns of vegetation - in the instance where two 'trees' are adjacent this should split into two distinct blobs.

Syntax (Substitute full paths for Binary & DHM and observed value for Value):

GDAL_CALC.py -A DHM --outfile=Binary --calc "A*(A>Value)"

Now with either GDAL_CALC or Esri IsNull create a binary raster, which can be polygonized with GDAL_Polygonize or Esri Raster to Polygon.

To refine the polygons remove excessively small polygons and then compare them to the RGB bands looking for signatures, in Esri the Zonal Statistics tool will help. Then you can discard the polygons that clearly don't have the right statistics (based on experimentation and your data, I can't give you the values).

This should get you to about 80% accuracy at plotting individual crowns.

2
  • Thanks. I'll see if I get good results out of this method. Commented Dec 4, 2014 at 7:54
  • You'll need to do some experimentation to get the appropriate values, I suggest clipping small areas as samples that are indicative of (similar to) the best/worst areas in your data. It might take half a dozen sample runs to get your parameters but that's still got to be better than plotting them manually. Commented Dec 4, 2014 at 21:36
3

eCognition is the best software for that, I did that using other software but eCognition its better. Here is the reference to literature on the subject:

Karlson, M., Reese, H., & Ostwald, M. (2014). Tree Crown Mapping in Managed Woodlands (Parklands) of Semi-Arid West Africa Using WorldView-2 Imagery and Geographic Object Based Image Analysis. Sensors, 14(12), 22643-22669.

e.g. http://www.mdpi.com/1424-8220/14/12/22643

Additionally:

Zagalikis, G., Cameron, A. D., & Miller, D. R. (2005). The application of digital photogrammetry and image analysis techniques to derive tree and stand characteristics. Canadian journal of forest research, 35(5), 1224-1237.

e.g. http://www.nrcresearchpress.com/doi/abs/10.1139/x05-030#.VJmMb14gAA

3
  • Could you please expand on why eCognition is better? Link only answers tend to become defunct when the link goes away.
    – Aaron
    Commented Dec 23, 2014 at 14:15
  • 1
    eCognition is object-based image analysis software other are not since I now. I used similar approach. The application of digital photogrammetry and image analysis techniques to derive tree and stand characteristics G Zagalikis, A D Cameron, D R Miller Canadian Journal of Forest Research, 2005, 35(5): 1224-1237, 10.1139/x05-030 nrcresearchpress.com/doi/abs/10.1139/x05-030#.VJmMb14gAA Commented Dec 23, 2014 at 15:40
  • 1
    Thanks for the reference Giorgos. I think these comments would work well as an edit to your answer.
    – Aaron
    Commented Dec 23, 2014 at 15:52
3

I had the same issue a couple of years ago. I have a solution that does not require filtered LAS data or other ancillary data. If you have access to LiDAR data, and can generate DEMs/DSMs/DHMs (DEM hereafter, I'm not debating the semantics of surface model nomenclature) from different returns, the following script may be useful.

The arcpy script ingests 3 DEMs and spits out a forest polygon and tree point shapefiles. The 3 DEMs should have the same spatial resolution (i.e. 1 meter) and extents, and represent first returns, last returns, and bare earth. I had very specific parameters for veg extraction, but the parameters can be altered to suit other needs. I am sure the process can be improved, as this was my first serious attempt at python scripting.

# Name:         Veg_Extractor.py
# Date:         2013-07-16
# Usage:        ArcMap 10.0; Spatial Analyst
# Input:        1 meter DEMs for first returns (DEM1), last returns (DEM2), and bare earth (BE)
# Output:       forest polygon (veg with height > 4m) shapefile with holes > 500m removed;
#               tree point (veg with height > 4m, crown radius of 9 cells) shapefile
# Notes:        Raises error if input raster cell sizes differ

import arcpy, os
from arcpy import env
from arcpy.sa import *

# Check out any necessary licenses
arcpy.CheckOutExtension("spatial")

# Script arguments
dem1 = arcpy.GetParameterAsText(0) #input Raster Layer, First Return DEM
dem2 = arcpy.GetParameterAsText(1) #input Raster Layer, Last Return DEM
bare_earth = arcpy.GetParameterAsText(2) #input Raster Layer, Bare Earth DEM
outForest = arcpy.GetParameterAsText(3) #shapefile
outTree = arcpy.GetParameterAsText(4) #shapefile

# Make sure cell size of input rasters are same
arcpy.AddMessage("Checking cell sizes...")
dem1Xresult = arcpy.GetRasterProperties_management(dem1, "CELLSIZEX")
dem1Yresult = arcpy.GetRasterProperties_management(dem1, "CELLSIZEY")
dem2Xresult = arcpy.GetRasterProperties_management(dem2, "CELLSIZEX")
dem2Yresult = arcpy.GetRasterProperties_management(dem2, "CELLSIZEY")
beXresult = arcpy.GetRasterProperties_management(bare_earth, "CELLSIZEX")
beYresult = arcpy.GetRasterProperties_management(bare_earth, "CELLSIZEY")
dem1X = round(float(dem1Xresult.getOutput(0)),4)
dem1Y = round(float(dem1Yresult.getOutput(0)),4)
dem2X = round(float(dem2Xresult.getOutput(0)),4)
dem2Y = round(float(dem2Yresult.getOutput(0)),4)
beX = round(float(beXresult.getOutput(0)),4)
beY = round(float(beYresult.getOutput(0)),4)
if (dem1X == dem1Y == dem2X == dem2Y == beX == beY) == True:
    arcpy.AddMessage("Cell sizes match.")
else:
    arcpy.AddMessage("Input Raster Cell Sizes:")
    arcpy.AddMessage("DEM1: (" + str(dem1X) + "," + str(dem1Y) + ")")
    arcpy.AddMessage("DEM2: (" + str(dem2X) + "," + str(dem2Y) + ")")
    arcpy.AddMessage("  BE: (" + str(beX) + "," + str(beY) + ")")
    raise Exception("Cell sizes do not match.")

# Check map units
dem1_spatial_ref = arcpy.Describe(dem1).spatialReference
dem1_units = dem1_spatial_ref.linearUnitName
dem2_spatial_ref = arcpy.Describe(dem2).spatialReference
dem2_units = dem2_spatial_ref.linearUnitName
bare_earth_spatial_ref = arcpy.Describe(bare_earth).spatialReference
bare_earth_units = bare_earth_spatial_ref.linearUnitName
if (dem1_units == dem2_units == bare_earth_units) == True:
    if dem1_units == "Meter":
        area = "500 SquareMeters" #Area variable for meter
        unit = 1 #meter
    elif (dem1_units == "Foot_US") or (dem1_units == "Foot"):
        area = "5382 SquareFeet" #Area variable for feet
        unit = 3.28084 #feet in meter
    else:
        raise Exception("Units are not 'Meter', 'Foot_US', or 'Foot'.")
else:
    raise Exception("Linear units do not match.  Check spatial reference.")

# Local variables:
(workspace, filename) = os.path.split(outForest)
arcpy.env.workspace = workspace
arcpy.env.overwriteOutput = True
dem1 = Raster(dem1)
dem2 = Raster(dem2)
bare_earth = Raster(bare_earth)
nbr1 = NbrRectangle(3, 3, "CELL")
nbr2 = NbrRectangle(5, 5, "CELL")
nbr3 = NbrCircle(5, "CELL")

# Give units and multiplier
arcpy.AddMessage("Linear units are " + dem1_units + ". Using multiplier of " + str(unit) + "...")

arcpy.AddMessage("Processing DEMs...")
# Process: Raster Calculator (DEM1 - BE)
ndsm_dem1 = dem1 - bare_earth

# Process: Raster Calculator (DEM1 - DEM2)
d1_d2 = dem1 - dem2

# Process: Raster Calculator
threshold_d1d2 = (d1_d2 > (0.1 * unit))  &  (ndsm_dem1 >= (4.0 * unit))

# Process: Focal Statistics (max 3x3)
focal_max1 = FocalStatistics(threshold_d1d2, nbr1, "MAXIMUM", "DATA")

# Process: Focal Statistics (majority 5x5)
focal_majority = FocalStatistics(focal_max1, nbr2, "MAJORITY", "DATA")

# Process: Con
con_ndsm_dem1 = Con(ndsm_dem1 >= (4.0 * unit), focal_majority, focal_max1)
focal_majority = None
focal_max1 = None

# Process: Focal Statistics (min 3x3)
focal_min1 = FocalStatistics(con_ndsm_dem1, nbr1, "MINIMUM", "DATA")
con_ndsm_dem1 = None

# Process: Focal Statistics (min 3x3)
veg_mask = FocalStatistics(focal_min1, nbr1, "MINIMUM", "DATA")

# Process: Focal Statistics (max R5)
focal_max2 = FocalStatistics(ndsm_dem1, nbr3, "MAXIMUM", "DATA")

arcpy.AddMessage("Calculating tree points...")
# Process: Raster Calculator
tree_points = (veg_mask == 1) & (ndsm_dem1 == focal_max2) & (ndsm_dem1 >= (4.0 * unit))
ndsm_dem1 = None
focal_max2 = None

# Process: Raster Calculator
tree_pick = Pick(tree_points == 1, 1)
tree_points = None

# Process: Raster to Polygon
arcpy.RasterToPolygon_conversion(tree_pick, workspace + "\\tree_poly.shp", "SIMPLIFY", "Value")
tree_pick = None

# Process: Feature To Point
arcpy.AddMessage("Writing tree points...")
arcpy.env.workspace = workspace #reset workspace
arcpy.env.overwriteOutput = True #reset overwrite permission
arcpy.FeatureToPoint_management(workspace + "\\tree_poly.shp", outTree, "CENTROID")

arcpy.AddMessage("Calculating forest polygons...")
# Process: Focal Statistics (max 3x3)
forests = FocalStatistics(veg_mask, nbr1, "MAXIMUM", "DATA")
veg_mask = None

# Process: Raster Calculator
forest_pick = Pick(forests == 1, 1)

# Process: Raster to Polygon
arcpy.RasterToPolygon_conversion(forest_pick, workspace + "\\forest_poly.shp", "SIMPLIFY", "Value")

# Process: Eliminate Holes > 500 sq m (5382 sq ft)
arcpy.AddMessage("Writing forest polygons...")
arcpy.EliminatePolygonPart_management(workspace + "\\forest_poly.shp", outForest, "AREA", area, "0", "CONTAINED_ONLY")

# Clean up
arcpy.AddMessage("Cleaing up...")
arcpy.Delete_management(workspace + "\\tree_poly.shp")
arcpy.Delete_management(workspace + "\\forest_poly.shp")
2

I am posting this as an answer due to length limit in comment, no hopes for credits:). Very broad brush, providing you've got DEM.

  1. Extract DEM for individual polygon to dem.
  2. Define dem's elevation extremes
  3. Set zCur+=-zStep. Step to be found by iterations beforehand, e.g. reasonable drop between 'tree top cell' elevation and neighbours
  4. Below=Con (dem => zCur, int (1))
  5. Group regions of Below. Count big enough, that are 'trees'. Definition required here by visual inspection, preliminary research?
  6. Goto step 3 if zCur> zMin, step 1 otherwise.

Maximum number of groups in the process = tree count inside individual polygon. Additional criteria, e.g. distance between 'trees' inside polygons might help... DEM smoothing using kernel also an option.

2
  • I believe you're referring to a DSM and not a DEM... Typically trees, structures and other junk doesn't make it into a DEM but feature in DSM (minus noise classes). DSM - DEM = DHM (height model). All of these can be extracted reasonably from LiDAR data, even if it is only classified ground/nonground, but if you have the DEM and not the LAS you're up the creek without a paddle because the features you're after aren't there! Commented Dec 3, 2014 at 4:49
  • Yeap, DHM as you described will do. I know little about Lidar.
    – FelixIP
    Commented Dec 3, 2014 at 8:55

Your Answer

By clicking “Post Your Answer”, you agree to our terms of service and acknowledge you have read our privacy policy.

Not the answer you're looking for? Browse other questions tagged or ask your own question.