3

I have a simple SHP line file - where each line has a unique reference. I have a related text csv file using the same reference, in a one-to-many situation. I need a map with the lines (in the 'one' side of the relationship) colour coded according to the number of matching entries (from the 'many' side of the relationship).

Practically this represents sections of route and repeated dated route inspection reports - and the map should show the total number of inspections for each bit of route. As it happens I also have the same route reports available with the addition of exactly matching geometries in a SHP or TAB file if I need them, but I don't need the geometry information as this is duplicated.

How can this map be produced (given that the format that the data is supplied in is fixed as Mapinfo TAB files which I'd assume to convert to SHP anyway - and that this needs to be an easily repeated process as data is updated).

2 Answers 2

4

In the CSV file you need a group by function to count the number of records for each id.

This is a typical database query. I would use Spatialite, where you can build a view (join) between your geometry and non geometry data (your CSV), where the non geometry data has been grouped and counted first. A virtual table like this can be shown with a graduation style.

I you don't like the database concept, you can use the Group Stat plugin to create a new CSV file, where the id's in the CSV file has been grouped and counted. Save the new CSV file, open it in QGIS. On the line layer add a join (Properties > Joins) between the line id and csv id (this is now a 1-1 join). Style the line layer with a graduated style choosing the joined count value for graduation style field.

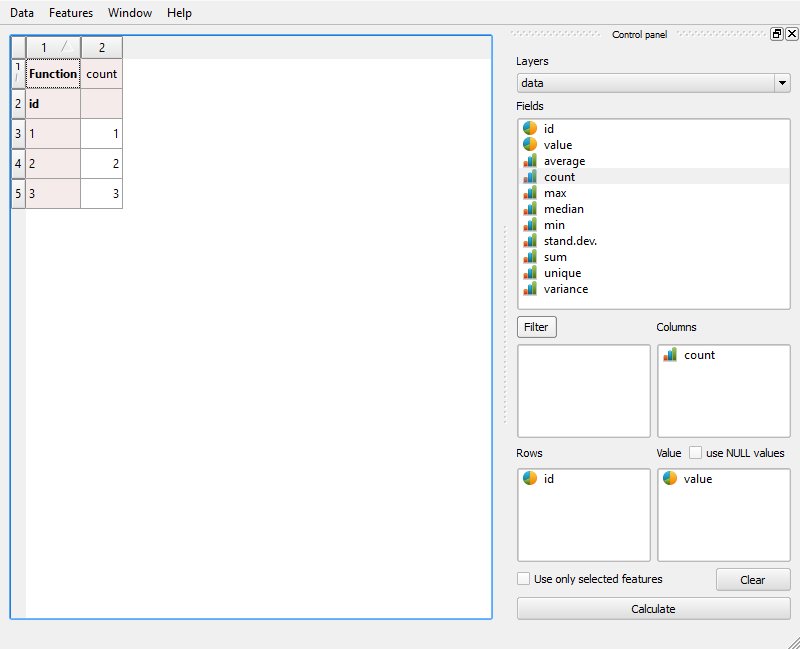
Below some images to help you through Group Stat plugin.

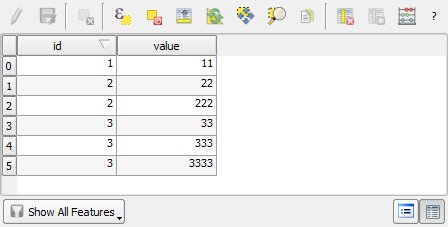
The line table:

enter image description here

The CSV layer:

enter image description here

Group Stat Plugin: (but note suggested change in the comments to the pictured settings) enter image description here

Save the Group Stat output as CSV, open it in QGIS and add as join on the line layer.

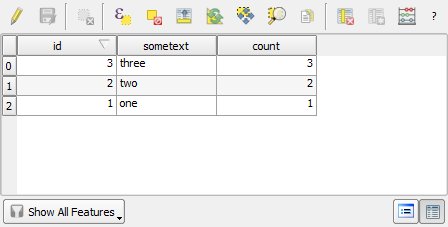
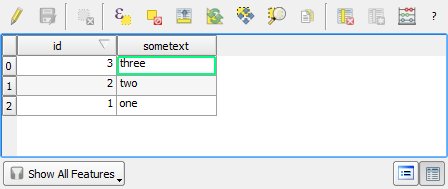
Count column from csv joined onto line table. Don't mind the id and count values are the same in my sample:

enter image description here

Create your graduated style from the count column.

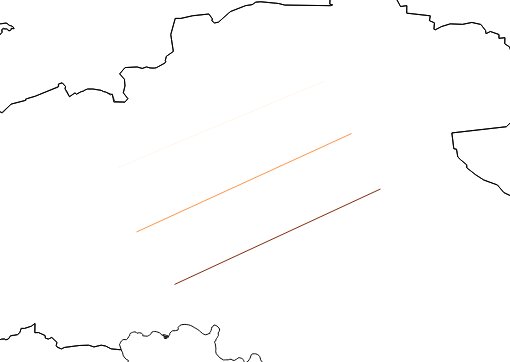
Line layer styled on number of occurrence in CSV. Top line hard to see:

enter image description here

5
  • Thanks. That's very helpful. I already explored both of those two solutions at length but had failed - and I needed to know that I was on the right lines before putting in more effort. I haven't understood the Group Stat interface - but with your example to hand I have renewed hope. I'd love to also see a parallel answer using the Spatialite route. I tried to work by using the spatialite-gui to create a spatialite file, importing both tables, and then creating a view (to load into QGIS). I can't make that work - succeeding with a SELECT statement, but not with creating a view. Commented Feb 11, 2015 at 9:39
  • I tested this and it worked well. Thank you. BUT I still don't entirely understand the Group Stats plugin. I think that adding 'Count' to the column box asks for a count column to be produced, adding 'id' to the row column gives us rows listed by id. But does adding the field name 'value' to the value box ask the plugin to count unique entries in this column field? Or does it do something else? Why do we need to bring this field into the calculation? And are joins in the layer property dialogue necessarily one-to-one (as opposed to the relation I previously created in the project properties). Commented Feb 11, 2015 at 14:07
  • As far as I can see its the column in the Rows-box that's used for counting. Not sure why a column is needed in the value-box when counting. Did you check the tutorial in the Group Stat Help menu.
    – Jakob
    Commented Feb 11, 2015 at 14:44
  • I spent a hours trying to understand this plugin until very late last night - I read everything I could find including the tutorial, but it didn't make any sense. I think I can see that the designers of the plugin are trying to make it intuitive... and I guess with some tweaking and proper help it might be easy to use. At the moment I'm not sure what key information I'm lacking... what is it I don't know about the basic functioning of the plugin that would make everything come clear? Now I understand the basic role of the row and column boxes (obvious only in retrospect) it helps a little. Commented Feb 11, 2015 at 15:01
  • Having spent more time investigating both of Jakob's answers I believe this is the simplest (unless you have sufficient database/SQL experience). The Group Stat plugin column and row boxes seem to work as I describe in an earlier comment. The 'value' box can actually have the 'id' column in it too (different to Jakob's answer) - which I believe means that the count function counts how many times an id appears. Thereafter it's easy to follow Jakob's other instructions - the join is specified in the properties of the line/parent table, which brings the count data into the line/parent table. Commented Feb 11, 2015 at 23:00
2

The Spatialite way on the same data as previous answer:

  1. Upload your lines and non spatial cvs data file to SpatiaLite using QSpatiaLite (QGIS plugin).
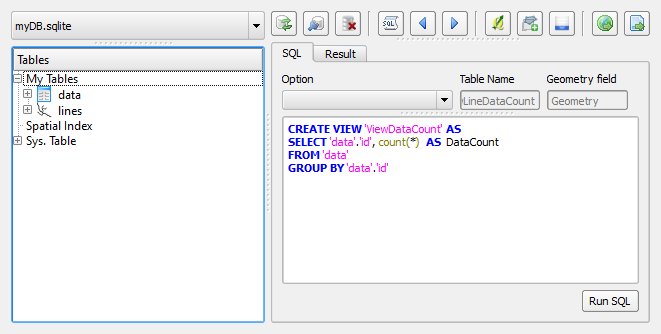
  2. Create a view on the data table (csv) counting the number of occurrences of the id:

enter image description here

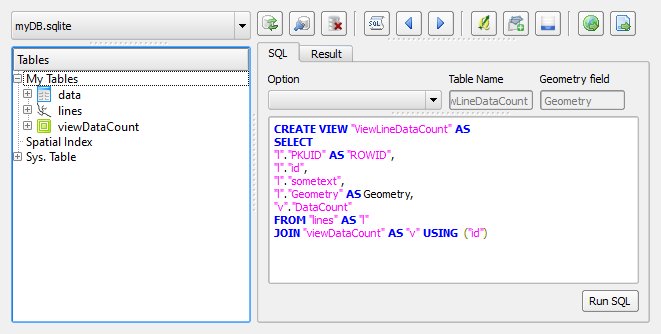
  1. Create a spatial view joining ViewDataCount to Lines

enter image description here

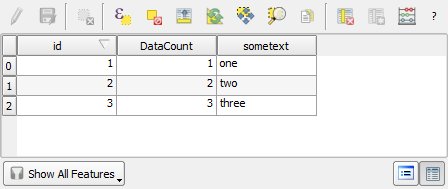
Attributes of ViewLineDataCount looks like: enter image description here

Open the spatial view ViewLineDataCount in QGIS and apply a graduated style on the DataCount column. It is import that you have a unique column named ROWID in you spatial view.

1
  • Thank you very much. I will take some time to evaluate both options. Commented Feb 11, 2015 at 12:59

Your Answer

By clicking “Post Your Answer”, you agree to our terms of service and acknowledge you have read our privacy policy.

Not the answer you're looking for? Browse other questions tagged or ask your own question.