3

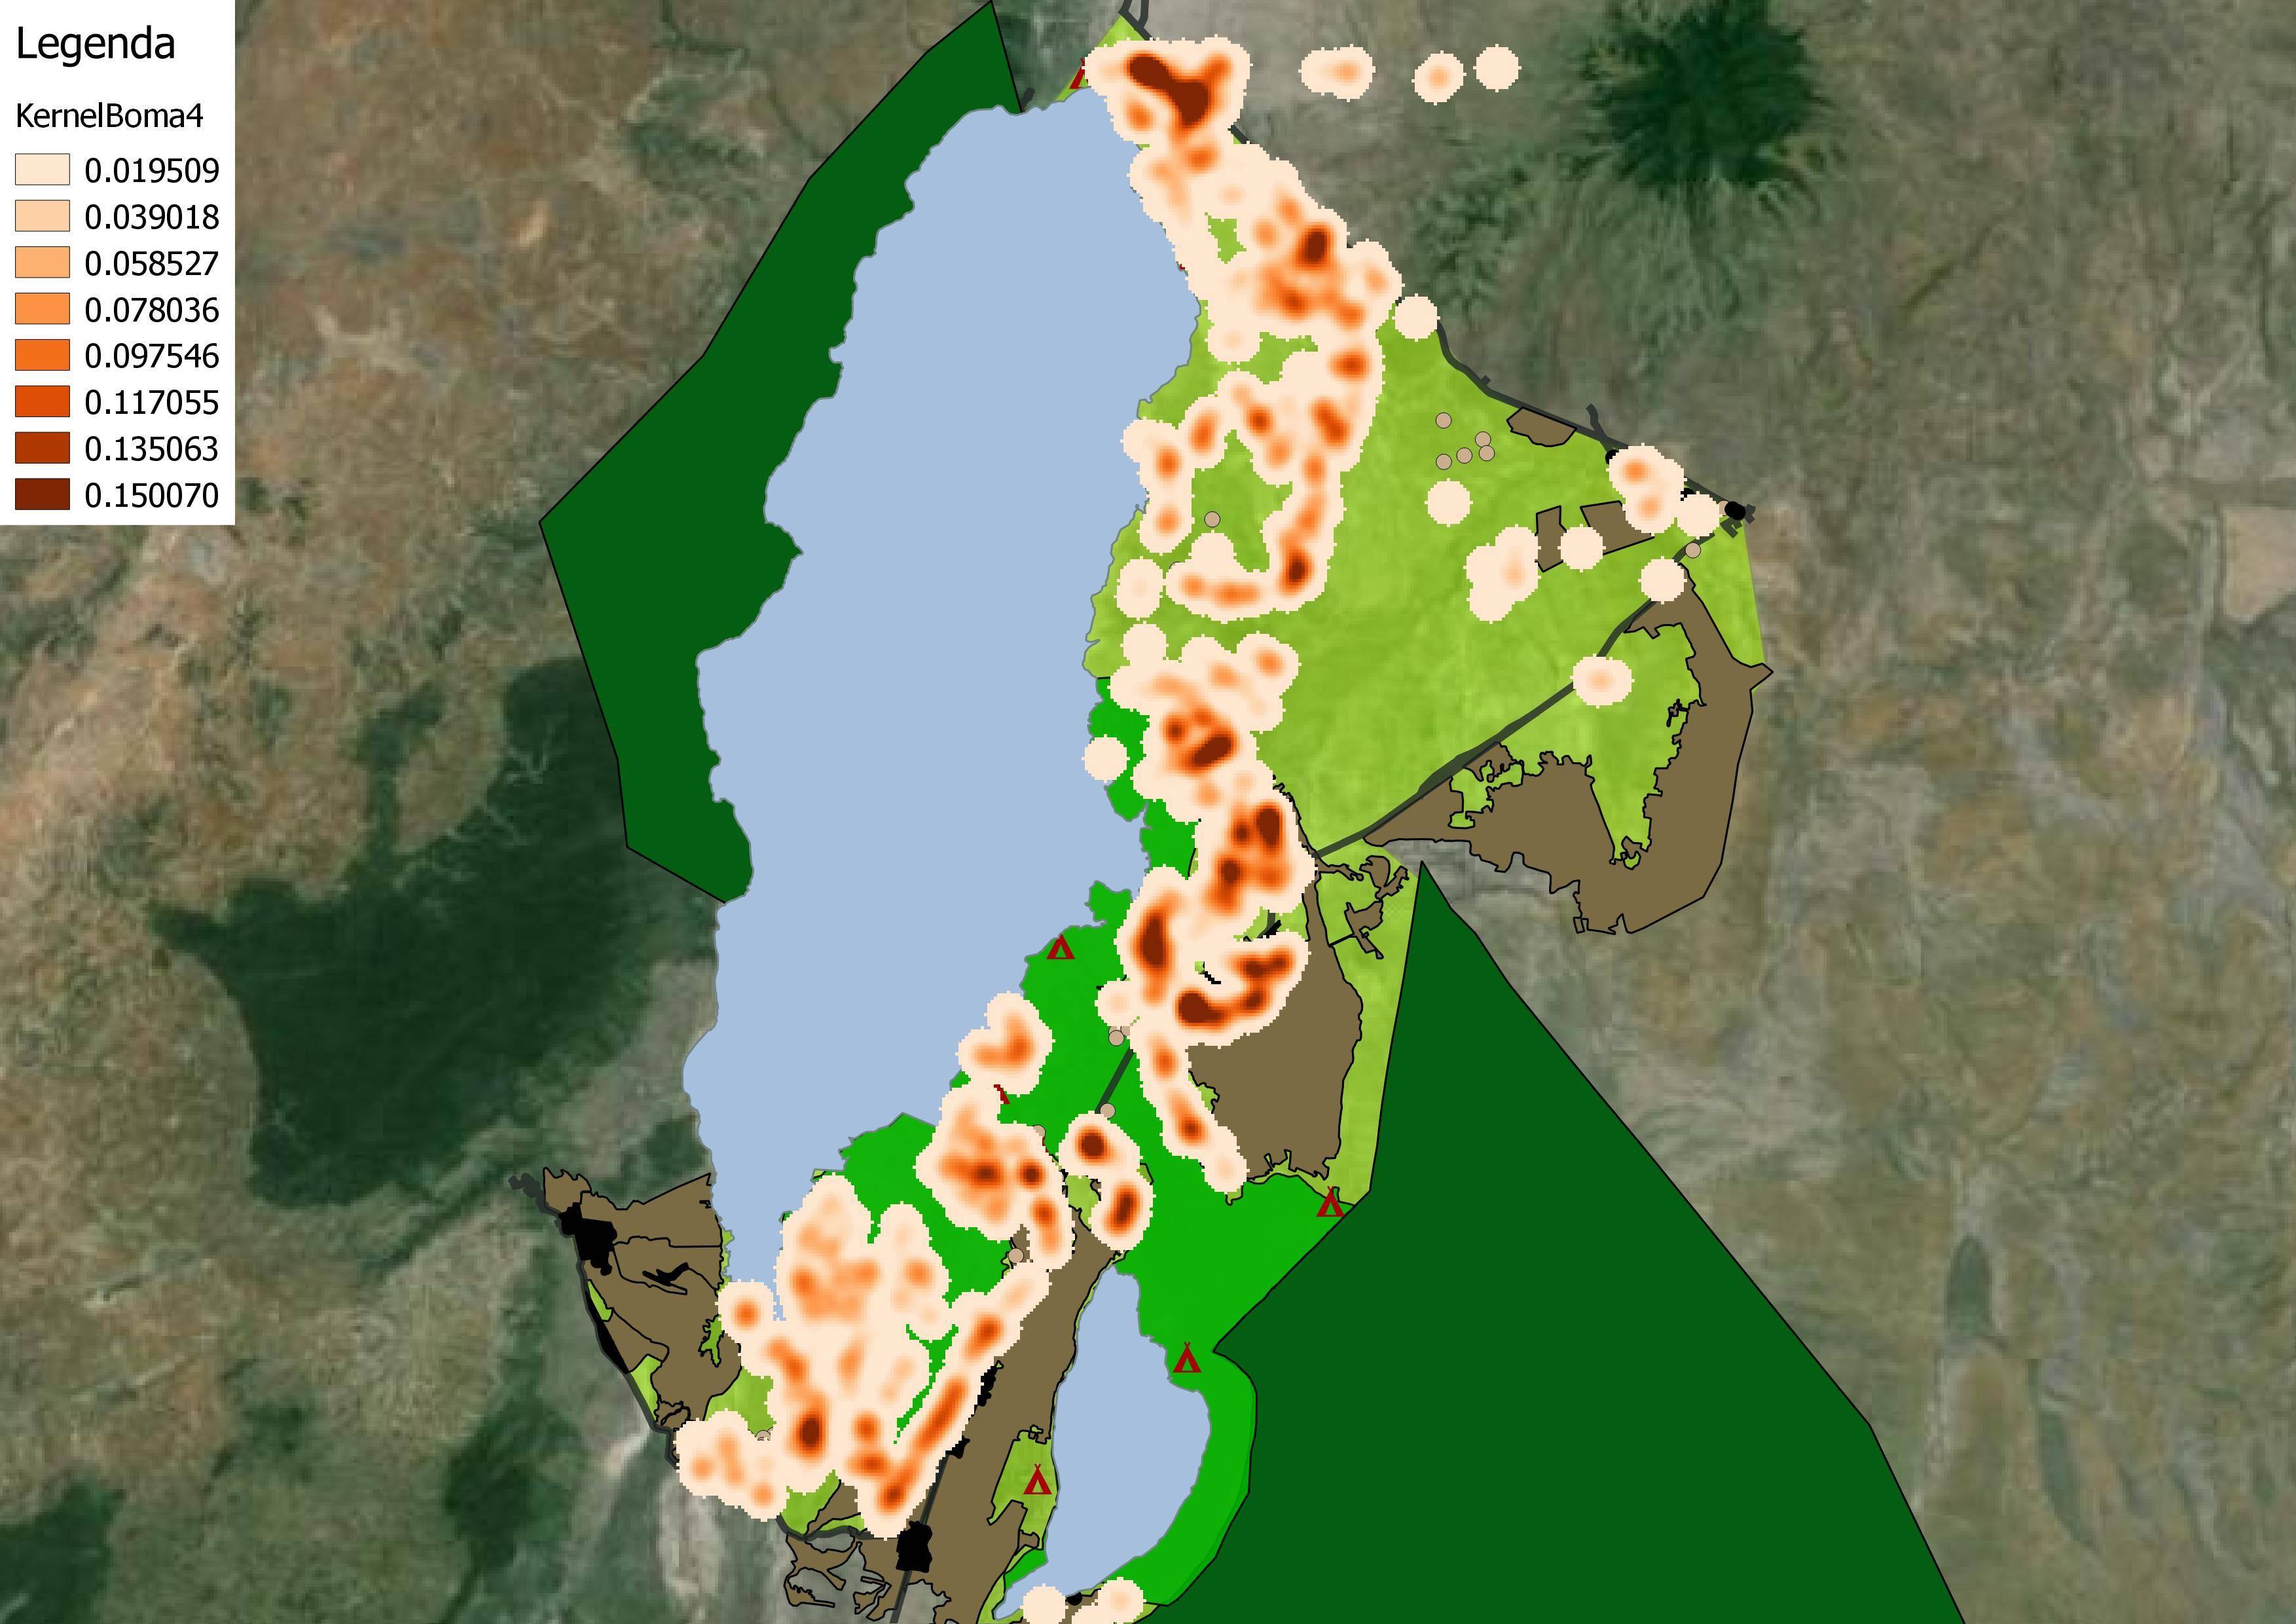
I am trying to create a heat map on human encroachment using the heatmap plugin of QGIS 2.2. I have no problems creating a good looking raster file using a 2 km radius but I can't find my way around the values that are created as a result. I would need values in a scale such as number of points/sq km. Can anybody help me out with this? I know it is a quite basic question but I can't seem to find a solution.

enter image description here

1
  • It would probably help to know your inputs, and what any settings or weights are. For instance what do your points represent - individual people? Weighted population counts?
    – Chris W
    Commented Apr 16, 2015 at 21:57

1 Answer 1

1

Maybe you would like to try a different way. First you can generate an empty vector grid like a fishnet (Vector > Research Tools > Vector Grid (Output Grid as Polygons!)), then you can make a spatial join (Vector > Data Management Tools > Join Attributes by Location (Take summary of intersecting features! > you will need the COUNT Field in the result shape file).

If the Cell size of the fishnet is 1 sq km (1000 m x 1000 m), the result is in the attribute field "COUNT" (Count of points/sq km). If you need a smaller cell size for the vector grid, you have to calculate the number of points/ sq km with the field calculator in a new column of the attribute table. For example, if the Cell size is 0,25 sq km (500 m x 500 m), you have to calculate the theoretical density for each cell: "COUNT" * 4 (0,25 sq km * 4 = 1 sq km).
Your Answer

By clicking “Post Your Answer”, you agree to our terms of service and acknowledge you have read our privacy policy.

Not the answer you're looking for? Browse other questions tagged or ask your own question.