5

I'm trying to extrapolate a spatial model to a map in QGIS using the raster calculator. The model predicts the value of a pixel given the environmental conditions at this location (e.g. elevation, slope, ect.). Hence, each explanatory variable is a raster layer. For the model I centered my covariates by subtracting the mean and dividing by the standard deviation. Now I want to do the same to my raster layers. As trivial as this seems, I didn't manage to do so. I tried (among similar attempts - like changing upper case, etc.):

(my.raster-mean(my.raster))/sd(my.raster)

The calculator tells me the expression is valid, however, mean() and sd() don't work.

And I could not find a site with the built-in functions for the raster calculator.

2
  • Seeing as mean and standard deviation are constant for a given raster can you insert the real values from the raster properties? Commented May 28, 2015 at 5:34
  • That's what I ended up doing now, however, since I have multiple layers it would be convenient if I could do this somehow within raster calculator. Also I'm a bit reluctant to copy-paste solutions as it seems always prone to errors. I just figured there would be some built-in function for that. Commented May 28, 2015 at 6:40

1 Answer 1

6

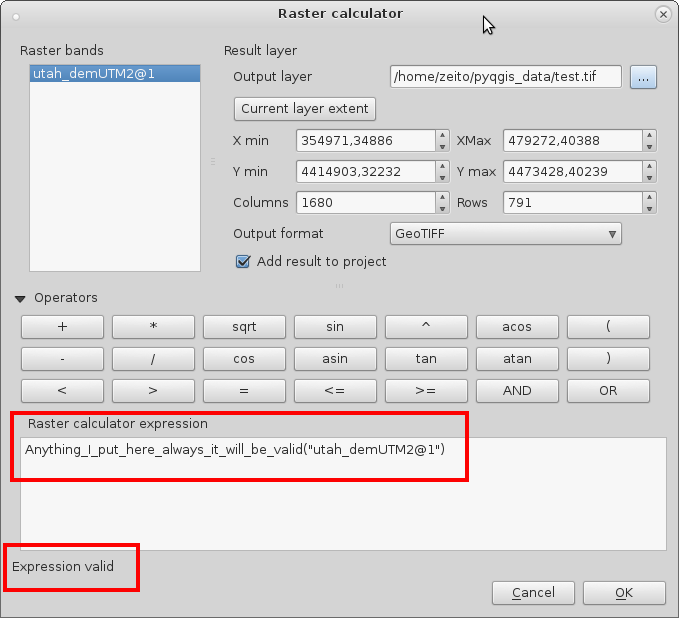
Raster calculator is a wrong tool to do that because it is for map algebra. The mean(my.raster) or sd(my.raster) expressions return my_raster (not the constants that you are hoping). For this reason, your expression (my.raster-mean(my.raster))/sd(my.raster) will be evaluated to 0 for each pixel.

At the below image you can see that any "function" it will be "valid" and it will return the same raster.
enter image description here

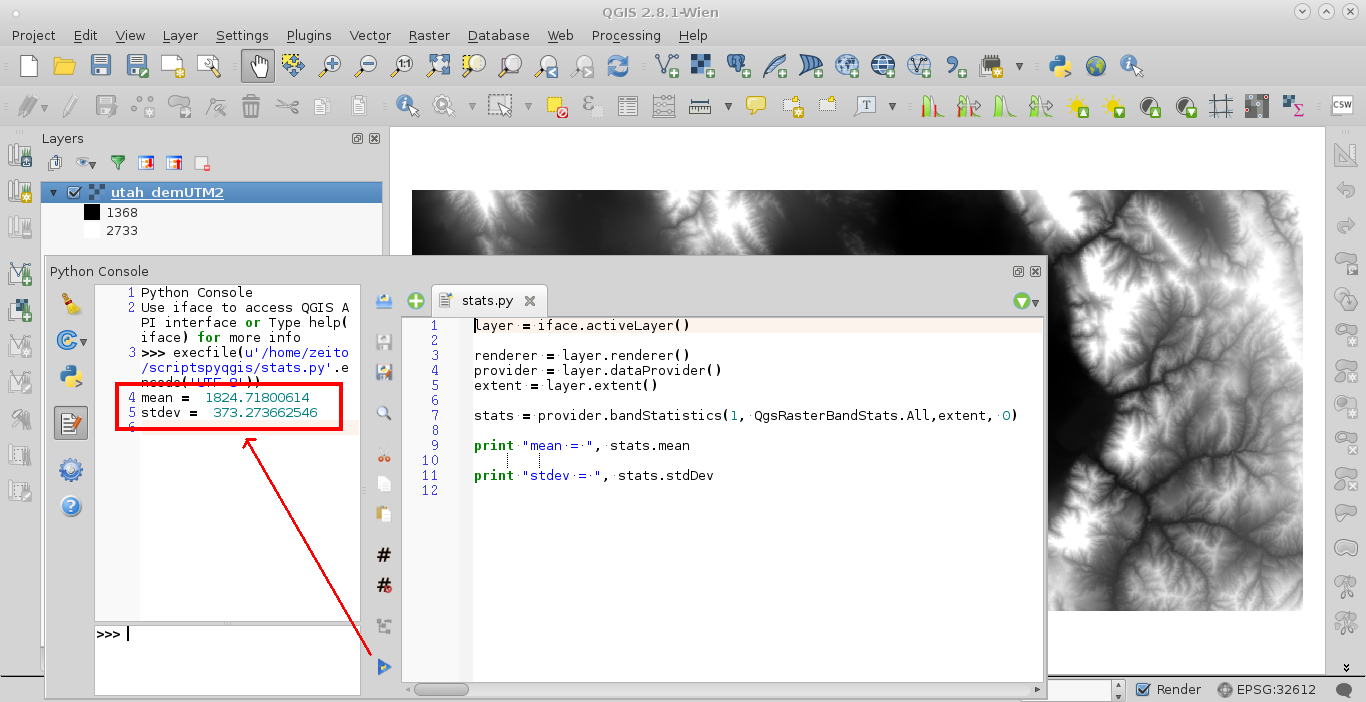
As it was pointed out by Michael, you need to evaluate mean and standard deviation constants first by other methods. You can do that with GDAL-python, PyQGIS or R (with rgdal o raster libraries).

Next, one example with PyQGIS:
enter image description here

For the complete process, you need to adapt this solution:

Qgis raster calculator not giving output

Editing Note 1:

The complete solution is this:

from qgis.analysis import QgsRasterCalculator, QgsRasterCalculatorEntry

layer = iface.activeLayer()
entries = []

# Define band1
band1 = QgsRasterCalculatorEntry()
band1.ref = 'band@1'
band1.raster = layer
band1.bandNumber = 1
entries.append( band1 )

renderer = layer.renderer()
provider = layer.dataProvider()
extent = layer.extent()

stats = provider.bandStatistics(1, QgsRasterBandStats.All,extent, 0)

myMean = stats.mean
myStdDev = stats.stdDev

myFormula = '(band@1 -' + str(myMean) +')/' + str(myStdDev)

print "mean = ", myMean 

print "stdev = ", myStdDev

# Process calculation with input extent and resolution
calc = QgsRasterCalculator( myFormula, 
                            '/home/zeito/pyqgis_data/outputfile.tif', 
                            'GTiff',
                            layer.extent(), 
                            layer.width(), 
                            layer.height(), 
                            entries )

calc.processCalculation()

It works nicely.

Editing Note 2:

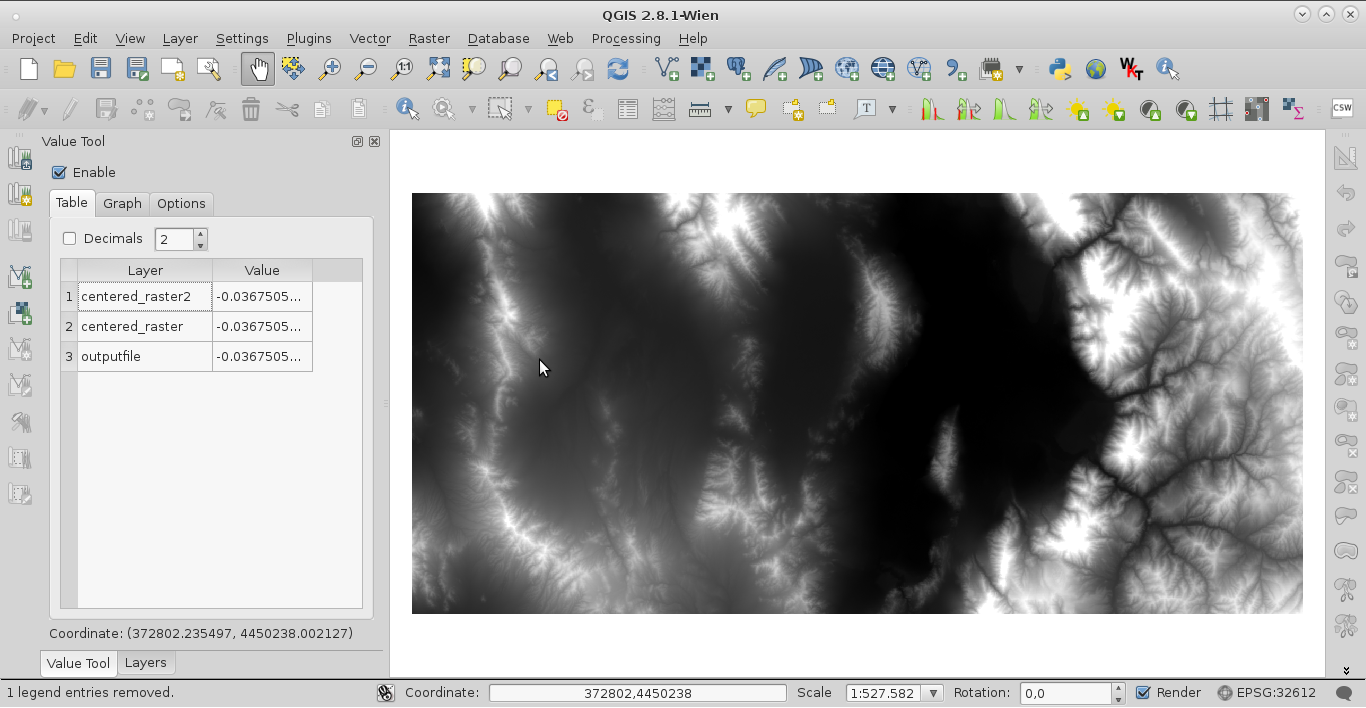
This is the complete code with R (Benedikt Gehr approach and RobertH approach). It is really simple and the results are the same (see image below with Value Tool Plugin).

setwd('pyqgis_data') #where is my_raster
library(raster)
my_raster<-raster('utah_demUTM2.tif')
#Benedikt Gehr approach
centered_raster<-(my_raster-cellStats(my_raster,mean))/(cellStats(my_raster,sd))
#RobertH approach
centered_raster2 <- scale(my_raster)
writeRaster(centered_raster, 'centered_raster.tif', format='GTiff',overwrite=TRUE)
writeRaster(centered_raster2, 'centered_raster2.tif', format='GTiff',overwrite=TRUE)
enter image description here

However, these approaches require the rgdal library installed. Sometimes, Windows users have problems with its installation.

4
  • 1
    the complete process solution for R using the "raster" package is very simple: centered_raster<-(my_raster-cellStats(my_raster,mean))/(cellStats(my_raster,sd) Thank you for pointing me in the right direction! Commented May 28, 2015 at 9:35
  • You're welcome. You can see my complete solution with PyQGIS too (I edit my answer). The advantage is that you can load the output raster directly in QGIS.
    – xunilk
    Commented May 28, 2015 at 10:40
  • 1
    In R it can actually be simpler than that: centered_raster <- scale(my_raster) Commented May 30, 2015 at 0:04
  • @RobertH I know that R is really amazing and it was one of my sugestions. For this reason, I edited my answer to include both approaches.Thank you.
    – xunilk
    Commented May 30, 2015 at 17:58

Your Answer

By clicking “Post Your Answer”, you agree to our terms of service and acknowledge you have read our privacy policy.

Not the answer you're looking for? Browse other questions tagged or ask your own question.