Russell Congalton literally wrote the book on the subject: Assessing the Accuracy of Remotely Sensed Data: Principles and Practices, Second Edition (Mapping Science). I highly recommend reading it.
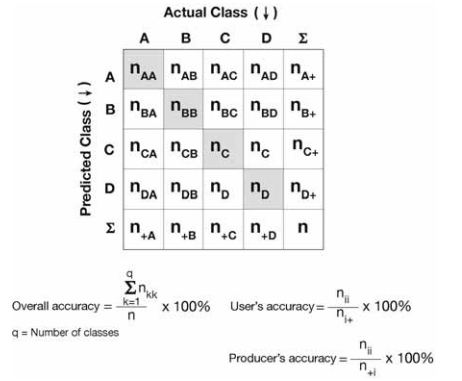
The most common way to assess the accuracy of a categorical land cover map is by using a confusion matrix (aka error matrix). The following shows the layout of a confusion matrix:

You can see that the validation classes, or "actual" values are along the x axis and the "predicted" classes, or your classified land cover map, are along the y axis. The matrix yields "user's accuracy", "producer's accuracy" and "overall accuracy". You can read more about those metric from Congalton (2008) or here. You can also calculate the KHAT statistic, which is the measure of agreement "...based on the difference between the actual agreement in the error matrix ... and the chance agreement that is indicated by the row and column totals..." (Congalton, 2008).
There are several options to actually put this into action. Erdas Imagine has an accuracy assessment tool. You can use a pivot table and formulas in Excel. Or, I prefer to do the accuracy assessments in R.
The following example from the caret package shows how the confusion matrix works. Of course, you would substitute your land cover classes for the iris species.
 library(caret)

## 3 class example

confusionMatrix(iris$Species, sample(iris$Species))

newPrior <- c(.05, .8, .15)
names(newPrior) <- levels(iris$Species)

confusionMatrix(iris$Species, sample(iris$Species))
> confusionMatrix(iris$Species, sample(iris$Species))
Confusion Matrix and Statistics

            Reference
Prediction   setosa versicolor virginica
  setosa         18         16        16
  versicolor     17         18        15
  virginica      15         16        19

Overall Statistics

               Accuracy : 0.3667
                 95% CI : (0.2896, 0.4492)
    No Information Rate : 0.3333
    P-Value [Acc > NIR] : 0.2168

                  Kappa : 0.05
 Mcnemar's Test P-Value : 0.9925

Statistics by Class:

                     Class: setosa Class: versicolor Class: virginica
Sensitivity                 0.3600            0.3600           0.3800
Specificity                 0.6800            0.6800           0.6900
Pos Pred Value              0.3600            0.3600           0.3800
Neg Pred Value              0.6800            0.6800           0.6900
Prevalence                  0.3333            0.3333           0.3333
Detection Rate              0.1200            0.1200           0.1267
Detection Prevalence        0.3333            0.3333           0.3333
Balanced Accuracy           0.5200            0.5200           0.5350
>

