5

I'm converting csv data to shapefiles using the pyshp python library. What I want to do is very similar to Using pyshp to convert .csv file to .shp?, except that I don't know how to handle polygons.

My data is in a csv file. Each row corresponds to a named rectangle, i.e. a string and the latitude or longitude coordinates of each side of the rectangle: left side (xl), right side (xr), top (yt) and bottom (yb).

So my data looks like this:

name,xl,xr,yt,yb
some Name,-25.3125,22.5,47.517193,31.353634
another Name,-103.359375,-0.703125,80.87282,74.40216
...

And my python code is pretty simple. It is only slightly modified from the points example. But when I try to import this data into google maps, it has some errors parsing it. So I think I'm doing something wrong, but I'm not sure what?

#Set up blank lists for data
name, polyPart = [],[]

#read data from csv file and store in lists
with open(in_file, 'rb') as csvfile:
  r = csv.reader(csvfile, delimiter=',')
  for i,row in enumerate(r):
    if i > 0: #skip header

      # parse data into a point array representing the bounding box
      xl = float(row[1])
      xr = float(row[2])
      yt = float(row[3])
      yb = float(row[4])
      tl = [xl, yt]
      tr = [xr, yt]
      br = [xr, yb]  
      bl = [xl, yb]
      parr = [tl, tr, br, bl, tl]

      # array of one "part", the part is an array of points
      polyPart.append([parr])
      name.append(row[0])

#Set up shapefile writer and create empty fields
maxStringLength = 50
w = shp.Writer(shp.POLYGON)
w.field('name','C',maxStringLength)

#loop through the data and write the shapefile
for j, name in enumerate(name):
  w.poly(parts=polyPart[j])
  w.record(name)

#Save shapefile
w.save(out_file)
1
  • Hi all these codes that have been mentioned here we know before only what all fields are there in a csv file. What if i don't know what is there in the csv file. Can anyone tell me how can we write a generic code which can work with any csv file as an input and convert it into a shape file??? Commented Aug 20, 2015 at 9:54

4 Answers 4

4

Your approach is good, but you could make things clearer using dictionaries instead of list and the csv module allows it.
Moreover, your script use two loops while it is possible to simplify using only one (the second loop is redundant, one line of the csv file = one record of the shapefile).

1) With dictionaries:

Reading the csv file:

with open('your.csv', 'rb') as f:
    reader = csv.DictReader(f)
    for row in reader:
        print row
 {'xr': '22.5', 'yb': '31.353634', 'name': 'some Name', 'xl': '-25.3125', 'yt': '47.517193'}
 {'xr': '-0.703125', 'yb': '74.40216', 'name': 'another Name', 'xl': '-103.359375', 'yt': '80.87282'} 

You can now use row['xr'] or row['name'] instead of row[n] (more explicit)

So your script becomes:

import csv
polyName, polyPart = [],[]
with open('your.csv', 'rb') as f:
   reader = csv.DictReader(f)
   for row in reader:
       bl  = [float(row['xl']),float(row['yb'])]
       tl  = [float(row['xl']),float(row['yt'])]
       br  = [float(row['xr']),float(row['yb'])]
       tr  = [float(row['xr']),float(row['yt'])]
       parr = [tl, tr, br, bl, tl]
       polyName.append(row['name'])
       polyPart.append(parr)

Writing the polygon shapefile

If you look at PyShpDocs you can see that:

A polygon is defined by:

w = shapefile.Writer(shapefile.POLYGON)
w.line(parts=[[[1,5],[5,5],[5,1],[3,3],[1,1]]])

and the script, as you wrote is:

 import shapefile
 # create the Polygon shapefile
 w = shapefile.Writer(shapefile.POLYGON)
 # the field
 w.field('name','C',maxStringLength)
 # write the polygons in the shapefile
 for part,name in zip(polyPart, polyName):
      w.poly(parts=[part])
      w.record(name) 
 #save the shapefile
 w.save('your.shp')

2) Final solution using only one loop

But the second loop is not necessary here: you can do it all with one loop (reading the csv file and writing the shapefile without using the polyName and polyPart lists).

w = shapefile.Writer(shapefile.POLYGON)
w.field('name','C',50)
with open('your.csv', 'rb') as f:
    reader = csv.DictReader(f)
    for row in reader:
        bl  = [float(row['xl']),float(row['yb'])]
        tl  = [float(row['xl']),float(row['yt'])]
        br  = [float(row['xr']),float(row['yb'])]
        tr  = [float(row['xr']),float(row['yt'])]
        parr = [tl, tr, br, bl, tl]
        w.poly(parts=[parr])
        w.record(row['name'])

w.save("your.shp')

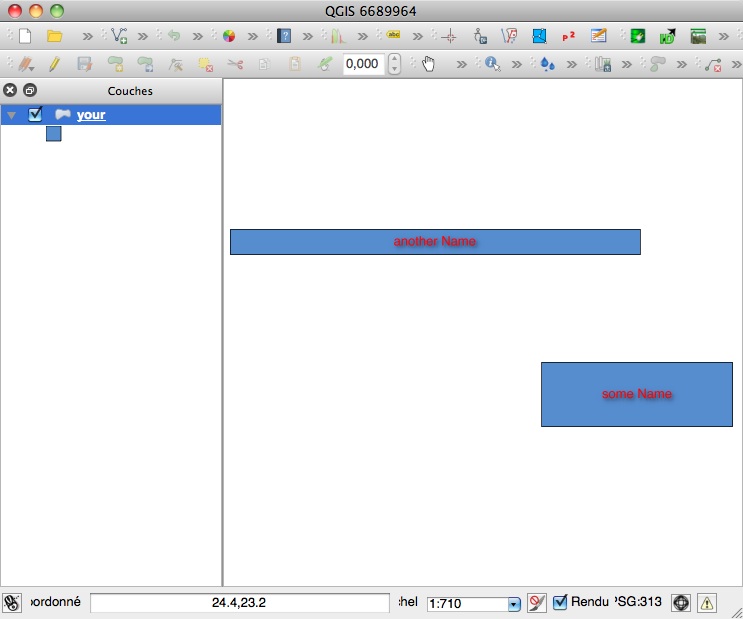
Result in QGIS:

enter image description here

0
3

It's not good coding practice to set your iterator variable in a for loop to the same name of the list you are looping over. You should change one of the name variables.

I ran your code on my machine with your small dataset and it correctly created the shapefile. I'm able to view it in ArcMap, along with the attribute table. Of course, there is no spatial reference associated with this data, so you'll likely want to define one, like described here. I would definitely implement this before proceeding any further.

At any rate, you might find it easier to work with this. I (hopefully) simplified a few things:

import shapefile as shp
import csv
in_file = "C:/users/paul/desktop/test.csv"
out_file = "C:/users/paul/desktop/test.shp"

#Set up blank lists for data
polyName, polyPart = [],[]

#read data from csv file and store in lists
with open(in_file, 'rb') as csvfile:
  r = csv.reader(csvfile, delimiter=',')  
  #Automagically skip header.
  next(r, None)

  for row in r:
      # parse data into a point array representing the bounding box
      xl = float(row[1])
      xr = float(row[2])
      yt = float(row[3])
      yb = float(row[4])
      tl = [xl, yt]
      tr = [xr, yt]
      br = [xr, yb]  
      bl = [xl, yb]
      parr = [tl, tr, br, bl, tl]

      # array of one "part", the part is an array of points
      polyPart.append([parr])
      polyName.append(row[0])

#Set up shapefile writer and create empty fields
maxStringLength = 50
w = shp.Writer(shp.POLYGON)
w.field('name','C',maxStringLength)

#loop through the data and write the shapefile
for part,name in zip(polyPart, polyName):
  w.poly(parts=part)
  w.record(name)

#Save shapefile
w.save(out_file)
3

You could do this in a few lines with shapely and GeoPandas (which uses Fiona under the hood for file i/o). You can use shapely.geometry.box to create the rectangles, convert it to a GeoDataFrame, and use the to_file method to save as a shapefile:

from pandas import DataFrame
from geopandas import GeoDataFrame
from shapely.geometry import box

data = DataFrame.from_csv('rect.csv')
boxes = [box(row['xl'], row['yb'], row['xr'], row['yt'])
         for key, row in data.iterrows()]
df = GeoDataFrame(boxes, columns=['geometry'], index=data.index)
df.to_file('out.shp', driver='ESRI Shapefile')
0

here is the code written with shapefile import every line commented well to write the code in efficient way. it writes the shapefile with projection.

import shapefile
import csv
import ast
# read csv
with open(r"Sample_Data.csv", encoding="utf8") as csvfile:
    # dict create
    dictReader=csv.DictReader(csvfile)
    # create writable shapefile
    w = shapefile.Writer('Sample_Data.shp')
    # create attribute
    w.field('id', 'C')
    w.field('nieghborho', 'C')
    w.field('plan_no', 'C')
    # row from dict
    for row in dictReader:
        # write row attribute
        w.record(row['id'], row['nieghborhood'], row['plan_no'])
        # write geom
        w.poly([ast.literal_eval(row['geom'])])
    # create prj file
    prj = open("Sample_Data.prj", "w")
    epsg = 'GEOGCS["WGS 84",'
    epsg += 'DATUM["WGS_1984",'
    epsg += 'SPHEROID["WGS 84",6378137,298.257223563]]'
    epsg += ',PRIMEM["Greenwich",0],'
    epsg += 'UNIT["degree",0.0174532925199433]]'
    # save prj file
    prj.write(epsg)
    # close above shapefile
    w.close()

Your Answer

By clicking “Post Your Answer”, you agree to our terms of service and acknowledge you have read our privacy policy.

Not the answer you're looking for? Browse other questions tagged or ask your own question.