4

Reading the solution to PostGIS > Intersect two circles. Each Circle must be built from Long/Lat degrees plus radius got me thinking.

How can I graphically display a SQL query?

It doesn't need to be cartographic quality. A sketch for debugging purposes would be sufficient.

For example, this SQL is in the accepted solution:

SELECT 
ST_Touches(temp.point1, temp.point2) as geom_touches
, ST_Intersects(temp.point1, temp.point2) as geom_intersect

FROM (

SELECT * FROM 
ST_Buffer(ST_Transform(ST_GeomFromText('POINT(-105.05083 39.74823)', 4326), 2877), 1500) as point1
, ST_Buffer(ST_Transform(ST_GeomFromText('POINT(-105.04428 39.74779)', 4326), 2877), 1500) as point2

 )as temp

How could I draw ST_Touches() and ST_Intersects() - the geometry, not the boolean?

5 Answers 5

3

To quickly see the results of a PostGIS query, I still don't think there's anything as simple and fast as OpenJump.

Just do "File....Run Datastore Query", paste in your SQL, and you're good. No temporary views cluttering your database, no temporary shapefiles cluttering your filesystem.

To do further prodding with query results ("where is the overlap?", "why didn't they intersect?"), I often wrap any spatial output columns with ST_AsBinary, and copy-paste from pgAdmin into JTS TestBuilder. There, you can easily see all of the relationships between two geometries (touches, overlaps, crosses, etc). And the magical "Magnify Topology" feature can often show why you're not getting the query results you might expect. Just do SET bytea_output to hex before you copy-paste, so that the binary output in pgAdmin will be formatted in a way that TestBuilder can understand.

2

If you use QGIS, you can create a view out of the query and it'll display perfectly without any further messing around. QGIS is simple enough to install and use that I strongly recommend it if you're doing anything significant with PostGIS.

Link: http://www.qgis.org/en/site/

2

ST_Intersects you'd use ST_Intersection and see the output.

Well technically you'd use ST_Intersection as well to demonstrate ST_Touches though that probably isn't sufficient

http://postgis.net/docs/ST_Touches.html

or just draw them together as docs do above.

For ST_Intersection to demonstrate ST_Touches, I'd draw both geometries, overlay the intersection and demonstrate that the intersection lies solely in the boundary of both geometries. (boundary geometry you get for a geometry with ST_Boundary)

0

I think you can do this in QGIS with a virtual layer, but I've not been successful with it.

My quick & dirty way is to create a spatial view in PostgreSQL (often a materialized one) and add that to QGIS.

CREATE MATERIALIZED VIEW pkde.svw_tmp7 AS 
 WITH cte AS (
         SELECT st_difference(b.geom, m.geom) AS geom,
            'muni_diff_bnd'::text AS rel_type
           FROM xd1.table1 b,
            admbnd.table2 m
          WHERE st_intersects(b.geom, m.geom) = true
        )
 SELECT row_number() OVER () AS id,
    cte.geom,
    cte.rel_type
   FROM cte
WITH DATA;

A second option I use with remote systems when I RDP to servers with postgres databases in environments where I don't have access to a QGIS, is to generate a GeoJson feature collection. Obviously, you can't do this very well with large result sets but for the smaller ones, it works well.

WITH cte as (
    SELECT  row_id,geom,acres FROM public.table1 limit 4
)
-- Queries a list of features as a geojson feature collection
SELECT row_to_json(fc)FROM (
        SELECT 'FeatureCollection' AS type
                ,array_to_json(array_agg(f)) AS features
        FROM (
                SELECT 'Feature' AS type
            /* Change this to name of the actual geometry column.  Geom for native PostGIS data. Shape if it came from Esri.
            You can also st_transform to a another coordinate system (e.g ST_AsGeoJSON(ST_Transform(lg.shape,4326))::json AS geometry)
             */
                        ,ST_AsGeoJSON(lg.geom)::json AS geometry  
                        ,row_to_json((
                                        SELECT l
                                        FROM (
                        -- Put Attribute select here (but don't put the geometry field)
                                                SELECT row_id, acres

                                                ) AS l
                                        )) AS properties
                FROM cte  AS lg  /* <-- You need to specify your source table (or view)  */
                -- limit 5  /* Put a where clause or limit here to filter the query */
                ) AS f

        ) AS fc

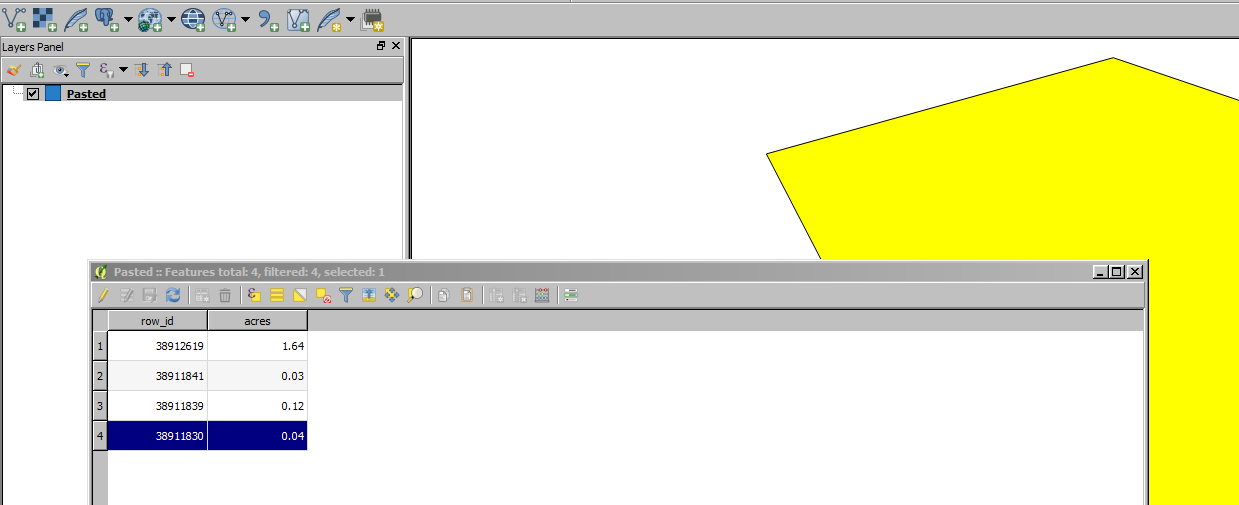
That'll give you a row with a GeoJSON Feature Collection:
enter image description here

And you can copy and paste that directly into a temporary scratch layer: enter image description here
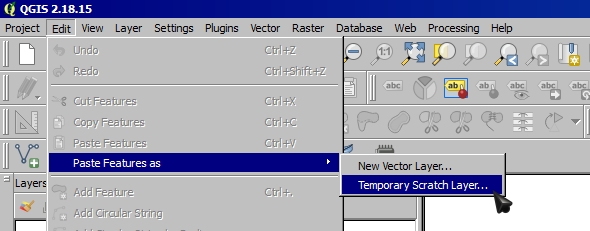
enter image description here

0

I don't see the QGIS DB Manager here!? IMO, since it's implementation and in 2018, it's the ultimate tool for complete PostGIS (and others) integration and ad-hoc table/query visualisation via QGIS UI.

Your Answer

By clicking “Post Your Answer”, you agree to our terms of service and acknowledge you have read our privacy policy.

Not the answer you're looking for? Browse other questions tagged or ask your own question.