4

The intent of this work is to define a buffer around a point or polygon based on information from a raster. For instance if a polygon representing a city and the raster defines how long it takes to pass through that cell (in hours for simplicities sake). I would like to construct a buffer around this city defining the maximum range that would sum up to 24 hours. Any cell can move to any other cell so long as they are moving towards the origin (The value of the origin cell is not included in the sum).

This will allow for the creation of non-uniform buffers based on environmental information rather than setting an arbitrary buffer around a polygon.

set.seed(8354)
r <-raster(matrix(ncol=5,nrow=5,abs(round(rnorm(25,5,5),0))))
e <- extent(c(0,5,0,5))
extent(r) <- e
plot(r)
points(2.5,2.5,cex=3,pch=19)

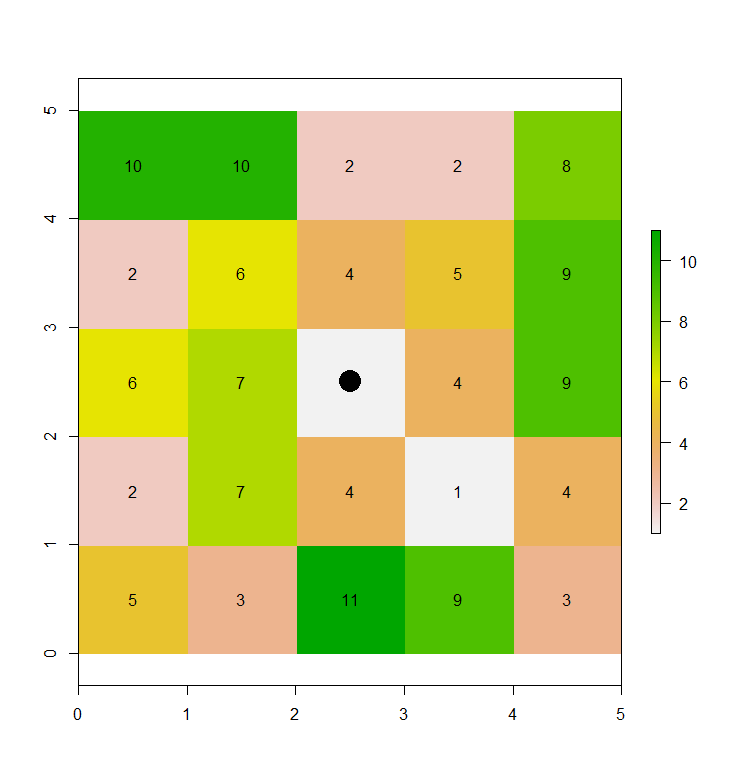
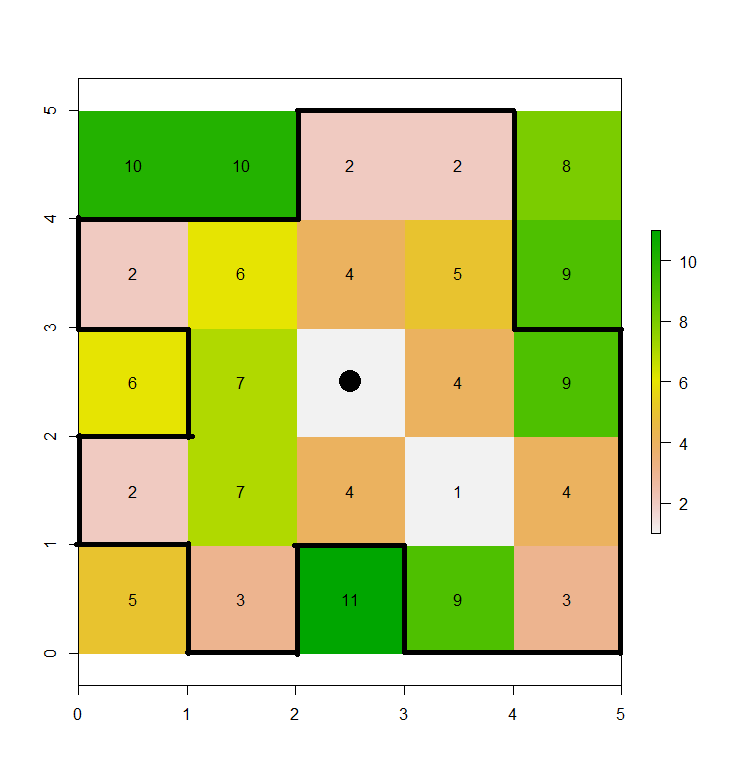
Below the images show the initial raster and the raster "buffered" out to outward values that equal 10. The intent to to move outward from the center cell in all 8 directions summing up values as progress is made. Upon achieving 10 the buffer is set to that extent, if the value exceeds 10, the current cell limits the extent.

One challenge I can already see is counting diagonally, in one instance the value may be less than 10 and in another greater, not really sure how to get around that as of yet.

I have been looking through the gdistance documentation as well as accCost as seen here. The transition function seems to be the hangup point. Much of that stems from my lack of understanding as to what this function is doing (I'll continue my reading). I've been using sum in the transitionFunction argument.

Values on the original raster

Initial Raster

Outward summation defining buffer extent

Buffered Raster

4
  • It isn't at all clear how the proposed process is supposed to produce "non-uniform" buffers. Could you perhaps illustrate what you have in mind?
    – whuber
    Commented Dec 24, 2015 at 16:43
  • How did you manage to include cells such as in the top row, four columns from the left, when that cannot be reached from one of the eight cardinal directions? With which cardinal direction have you associated it and on what basis?
    – whuber
    Commented Jan 4, 2016 at 18:18
  • And this is where I'm seeing that I have a fundamental flaw. It would have to move the origin to the next layer out and recalculate using the summed values from the first pass. This appears to be becoming a computationally limiting task under my current scheme as there would need to be a "new" raster for each cell to achieve the desired outcome. I will continue to ponder and come back with further refinements.
    – Badger
    Commented Jan 4, 2016 at 18:27
  • I am wondering whether backing up a step might be more fruitful. That is, instead of asking us how to carry out a specific operation that hasn't yet been well-defined, why don't you explain at a higher level what it is intended to accomplish or represent? That could be viewed by many readers as an invitation to suggest creative solutions that are otherwise precluded by what is perhaps an overly narrow question at present.
    – whuber
    Commented Jan 4, 2016 at 18:29

1 Answer 1

3

Using a neighbourhood matrix with adjacent gives you the cell numbers around a given cell, so you could extract values from increasing neighbourhoods until a threshold is reached.

Function to build a neighbourhood matrix to centre on a given point.

##' @param n size of neighbourhood matrix 3,5,7,...
nmatrix <- function(n) {
   ## n must be odd and > 1
   m <- matrix(1, n, n)
   m[ceiling(length(m) / 2)] <- 0
   m
}
## neighbours summing to 10 for a given point
sum0 <- 0
start0 <- 3
while(sum0 < 10) {
  ## extract all values in neighbourhood, including centre
  cells <- adjacent(r, cellFromXY(r, pt), directions = nmatrix(start0), include = TRUE)[,"to"]
  adjvalues <- r[cells]
  ## test sum of values 
  ## (could randomize order here or set a specific order for testing)
  # print(cumsum(adjvalues))
  sum0 <- sum(adjvalues)
  ## increment size of neighbourhood
  start0 <- start0 + 2
}

Once that while loop is done you have all the adjvalues from cells so you can use those to build whatever geometry is needed, perhaps by rasterToPolygons on a masked version of the raster.

This is a bit wasteful given that cells are multiply tested, but if your neighbourhoods tend to be small I don't think that's much of a problem.

The adjacent function is vectorized on cells so you could test across multiple points but that will make it more complicated and the efficiency gained perhaps not worth it.

4
  • An excellent answer and it does answer the question I had posed. I made an edit to include the notion that I am looking to travel linearly from the point, which makes things a little more challenging. This is a good jumping off point, thank you!
    – Badger
    Commented Dec 23, 2015 at 20:44
  • 1
    You can modify the 'directions' argument to get exactly the cells you want relative to the centre, I think that can cover the "linear" modification you want?
    – mdsumner
    Commented Dec 23, 2015 at 22:27
  • I'll work with it over the next while and let you know! Thanks for your help ilon this problem!
    – Badger
    Commented Dec 23, 2015 at 22:34
  • Quick point of clarification: How is the cellFromXY(r, pt) functioning. It worked earlier and now fails to. I'm curious as to what the intended outcome was. Sorted, it's my user defined point...
    – Badger
    Commented Jan 5, 2016 at 18:42

Your Answer

By clicking “Post Your Answer”, you agree to our terms of service and acknowledge you have read our privacy policy.

Not the answer you're looking for? Browse other questions tagged or ask your own question.