3

I am having trouble sampling multiple pixels from a raster layer at oe time. If I want to sample pixel data from a layer at a particular coordinate I can write.

ident = layers[0].dataProvider().identify(QgsPoint(357109.988, 6255412.925),QgsRaster.IdentifyFormatValue)

where my magic numbers come from the x and y coordinates of my CRS for my particular use case; however, I want to sample a rectangular subregion of the layer. looking at the API documentation ( https://qgis.org/api/classQgsRasterDataProvider.html#a33c343510d534f82c820579b9093fea1 )it appears that I can do something like this:

ident = layers[0].dataProvider().identify(QgsPoint(357109.988, 6255412.925),QgsRaster.IdentifyFormatValue,QgsRectangle(0,0,2,2),2,2)

and that does return a value, but it only returns one value. further googling has only turned up the API documentation.

How do I retrieve a nxm array full of band values centered around (or starting from) a point in a raster layer?

1
  • You need a loop for sampling raster values.
    – xunilk
    Commented May 27, 2016 at 11:02

2 Answers 2

1

There is a workaround using the processing.runalg() method, described in this post: Using in-memory vector layer with QGIS processing / SEXTANTE.

EDIT: the script I copied was for vector clipping (not raster). I replaced it by GDAL's Clip raster by extent algorithm which does precisely what you want. You need to use the path to your raster as an input (and not the raster itself), though:

out_raster = processing.runalg("gdalogr:cliprasterbyextent", "path/to/raster.tif", "", "0,0,2,2", "", None)
1

The API documentation says: "The context parameters theExtent, theWidth and theHeight are important to identify on the same zoom level as a displayed map and to do effective caching (WCS; Web Coverage Service). If context params are not specified the highest resolution is used". Then, I think that it always returns one value. For this reason, if you want to subsample a region of a raster layer's pixel data you can do something as this:

mapcanvas = iface.mapCanvas()

layers = mapcanvas.layers()

extent = layers[1].extent()
xSize = layers[1].rasterUnitsPerPixelX()
ySize = layers[1].rasterUnitsPerPixelY()

rows = layers[1].height()
columns = layers[1].width()

values = [[] for i in range(rows)]

xmin = extent.xMinimum() + xSize/2
ymax = extent.yMaximum() - ySize/2

y = ymax
for i in range(rows):
    x = xmin
    for j in range(columns):
        ident = layers[1].dataProvider().identify(QgsPoint(x, y), QgsRaster.IdentifyFormatValue)
        values[i].append(ident.results()[1])
        x += xSize
    y -= ySize

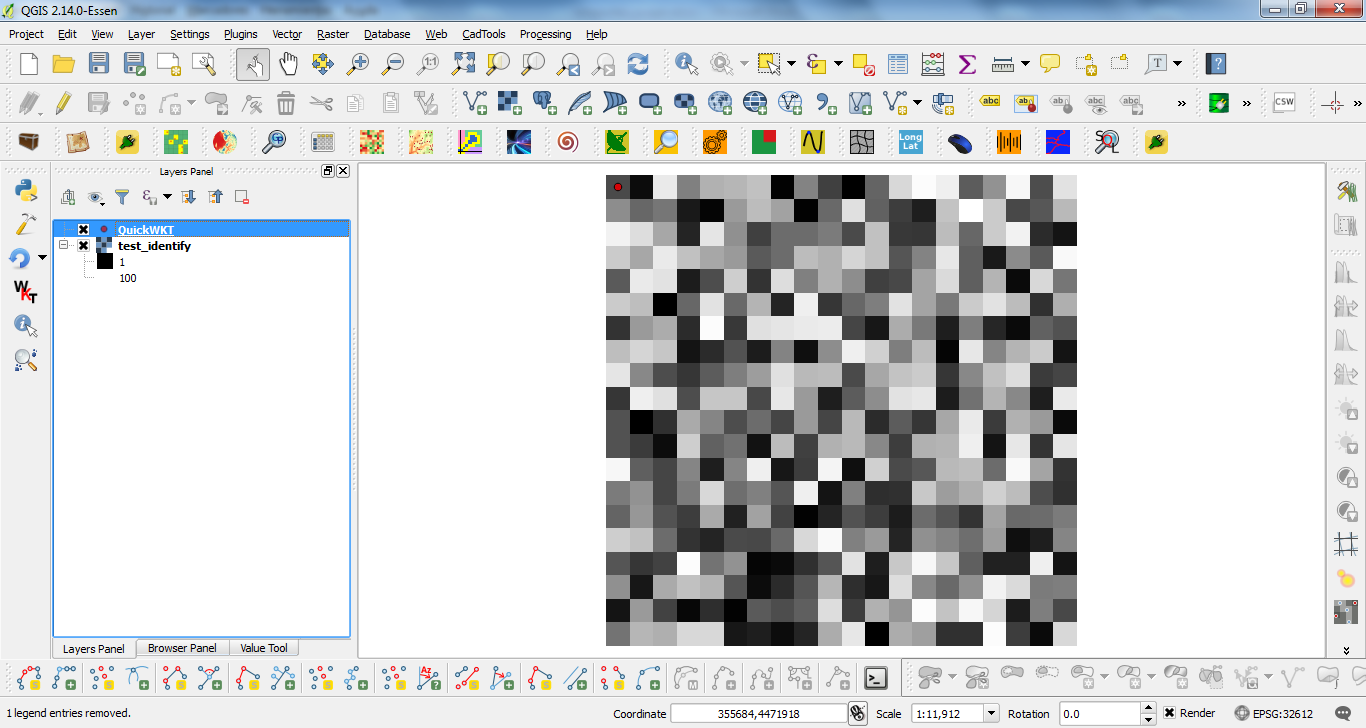
Above code, it samples all raster layer's pixel data (from red point; see below image) and put them in matrix format (it is very easy to change to array format with 'asarray' numpy method). I tried out with this tif image (20 x 20):

enter image description here

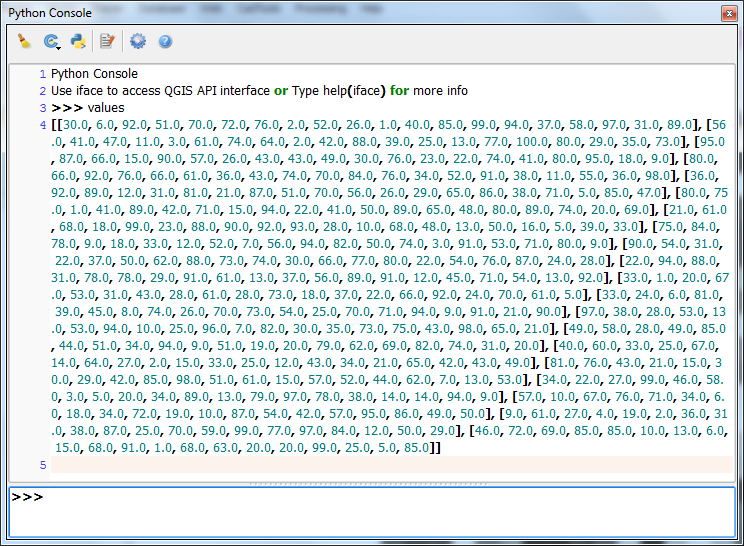
After running the code at the Python Console of QGIS I got this result:

enter image description here

where it was corroborated (with value tool plugin) that pixel values were adequately sampled.

Your Answer

By clicking “Post Your Answer”, you agree to our terms of service and acknowledge you have read our privacy policy.

Not the answer you're looking for? Browse other questions tagged or ask your own question.