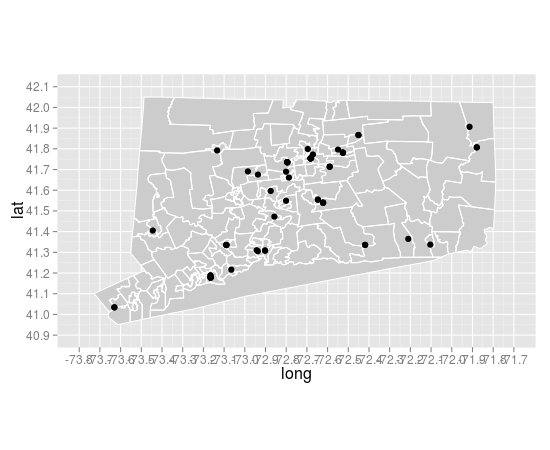
I created a map as below:

The map is created using the following script:
ct <- readShapeSpatial("housect_37800_0000_2010_s100_census_1_shp/wgs84/housect_37800_0000_2010_s100_census_1_shp_wgs84.shp")

ct_mod <- fortify(ct,region="SLDLST10")
chart <- ggplot(data=ct_mod,aes(long,lat))
chart <- chart + scale_x_continuous(limits=c(-73.8,-71.7),breaks=seq(-74,-71,0.1))
chart <- chart + scale_y_continuous(limits=c(40.9,42.1),breaks=seq(40,43,0.1))
chart <- chart + geom_polygon(fill="grey80",aes(group=group))
chart <- chart + geom_path(color="white",aes(group=group))
# coord_equal make x-y same scale
chart <- chart + coord_equal()

chart1 <- chart + geom_point(data=hosp.list,aes(x=coord_x,y=coord_y))
This is a map of the Connecticut Census State Legislative District Map with several hospitals located, you can see a few regions with a dot and others without. How can I fill the regions with dot using one colour and regions without dot using another colour?
