18

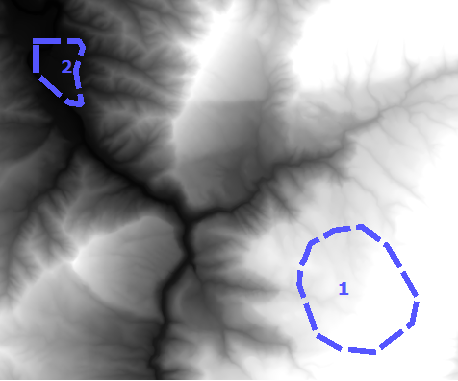
I have a shapefile with polygons. And I have a global raster file. I want to overlay the shapefile's polygons onto the raster grid and calculate the mean raster value for each polygon.

How can I do this using GDAL, writing the results to the shapefile?

2
  • 4
    Is GDAL the only tool you'd like to use?
    – Simbamangu
    Commented Mar 18, 2012 at 17:15
  • @Simbamangu no, basically anything is fine, and it would be great if it were in Python
    – andreash
    Commented Apr 16, 2012 at 15:25

9 Answers 9

9

In R you can do

library(raster)
library(rgdal)
r <- raster('raster_filename')
p <- readOGR('shp_path', 'shp_file')
e <- extract(r, p, fun=mean)

e is a vector with the mean of the raster cell values for each polygon.

1
  • This is R not python as asked in the question
    – G M
    Commented Jan 25, 2019 at 13:06
6

Following advice I got on the gdal-dev mailing list, I used StarSpan:

starspan --vector V --raster R1 R2 ... --stats mystats.csv avg mode

The results are saved to CSV format. At that time, that was already enough for me, but it should be possible to somehow forge a Shapefile from that info.

1
  • StarSpan seems to have moved to GitHub. Get it here.
    – Richard
    Commented Nov 27, 2014 at 5:05
5

The following script allows you to do the task with GDAL: http://pcjericks.github.io/py-gdalogr-cookbook/raster_layers.html#calculate-zonal-statistics

# Calculates statistics (mean) on values of a raster within the zones of an polygon shapefile

import gdal, ogr, osr, numpy

def zonal_stats(input_value_raster, input_zone_polygon):

    # Open data
    raster = gdal.Open(input_value_raster)
    driver = ogr.GetDriverByName('ESRI Shapefile')
    shp = driver.Open(input_zone_polygon)
    lyr = shp.GetLayer()

    # get raster georeference info
    transform = raster.GetGeoTransform()
    xOrigin = transform[0]
    yOrigin = transform[3]
    pixelWidth = transform[1]
    pixelHeight = transform[5]

    # reproject geometry to same projection as raster
    sourceSR = lyr.GetSpatialRef()
    targetSR = osr.SpatialReference()
    targetSR.ImportFromWkt(raster.GetProjectionRef())
    coordTrans = osr.CoordinateTransformation(sourceSR,targetSR)
    feat = lyr.GetNextFeature()
    geom = feat.GetGeometryRef()
    geom.Transform(coordTrans)

    # Get extent of geometry
    ring = geom.GetGeometryRef(0)
    numpoints = ring.GetPointCount()
    pointsX = []; pointsY = []
    for p in range(numpoints):
            lon, lat, z = ring.GetPoint(p)
            pointsX.append(lon)
            pointsY.append(lat)
    xmin = min(pointsX)
    xmax = max(pointsX)
    ymin = min(pointsY)
    ymax = max(pointsY)

    # Specify offset and rows and columns to read
    xoff = int((xmin - xOrigin)/pixelWidth)
    yoff = int((yOrigin - ymax)/pixelWidth)
    xcount = int((xmax - xmin)/pixelWidth)+1
    ycount = int((ymax - ymin)/pixelWidth)+1

    # create memory target raster
    target_ds = gdal.GetDriverByName('MEM').Create('', xcount, ycount, gdal.GDT_Byte)
    target_ds.SetGeoTransform((
        xmin, pixelWidth, 0,
        ymax, 0, pixelHeight,
    ))

    # create for target raster the same projection as for the value raster
    raster_srs = osr.SpatialReference()
    raster_srs.ImportFromWkt(raster.GetProjectionRef())
    target_ds.SetProjection(raster_srs.ExportToWkt())

    # rasterize zone polygon to raster
    gdal.RasterizeLayer(target_ds, [1], lyr, burn_values=[1])

    # read raster as arrays
    banddataraster = raster.GetRasterBand(1)
    dataraster = banddataraster.ReadAsArray(xoff, yoff, xcount, ycount).astype(numpy.float)

    bandmask = target_ds.GetRasterBand(1)
    datamask = bandmask.ReadAsArray(0, 0, xcount, ycount).astype(numpy.float)

    # mask zone of raster
    zoneraster = numpy.ma.masked_array(dataraster,  numpy.logical_not(datamask))

    # calculate mean of zonal raster
    return numpy.mean(zoneraster)
1
  • Hi, thank you for your script, I tried to run it but at the end it doesn't produce anything. How to visualize the statistics?
    – ilFonta
    Commented Apr 6, 2022 at 8:20
4

Load your shapefile and your raster in PostGIS 2.0 and do:

SELECT (ST_SummaryStats(ST_Clip(rast, geom))).*
FROM rastertable, geomtable
4

I don't think GDAL is the best tool for this, but you can use gdal_rasterize to "clear" all the values outside the polygon.

Something like:

gdal_translate -a_nodata 0 original.tif work.tif
gdal_rasterize -burn 0 -b 1 -i work.tif yourpolygon.shp -l yourpolygon
gdalinfo -stats work.tif
rm work.tif

The gdal_rasterize program modifies the file, so we make a copy to work on. We also mark some particular value (zero in this case) to be nodata. The "-burn 0 -b 1" means burn a value of zero into band 1 of the target file (work.tif). The "-i" means invert rasterization so we burn values outside the polygon instead of inside it. The gdalinfo command with -stats reports on band statistics. I believe it will exclude the nodata value (which we marked earlier with -a_nodata).

2

Transform the shape file in raster by gdal_rasterize and the use the code in http://www.spatial-ecology.net/dokuwiki/doku.php?id=wiki:geo_tools to calculate zonal statistic for each polygon. You can run http://km.fao.org/OFwiki/index.php/Oft-reclass if you want obtain a tif with your rasters statistic. Enjoy the code Ciao Giuseppe

1
  • Do you happen to have a copy of the code you refer to? Unfortunately the link to the Python file is dead.
    – ustroetz
    Commented May 21, 2013 at 17:51
2

You can also use rasterstats thas is a Python module designed for this purpose:

from rasterstats import zonal_stats
listofzones = zonal_stats("polygons.shp", "elevation.tif",
            stats="mean")

enter image description here

Then you can access the attribute of the first zone using:

mean_of_zone1 = listofzones[0]['mean']
1

This is not possible using GDAL. You could use other free tools however, eg saga gis:

saga_cmd shapes_grid "Grid Values to Shapes" -GRIDS=grid.sgrd -POLYGONS=in.shp -SHAPES=out.shp-NODATA -TYPE=1
1
  • I went with this approach, though the function name is actually "Grid Statistics for Polygons".
    – bananafish
    Commented Jan 18, 2013 at 4:46
-2

you can use calculate point statistics tool in arc gis and this tool can be download from http://ianbroad.com/arcgis-toolbox-calculate-point-statistics-polygon-arcpy/

1
  • 2
    "The Calculate Point Statistics tool takes an input Polygon and Point feature class and uses a selected field to find the minimum, maximum, and average of the points and adds the results to the polygon feature." but this question is about a Polygon feature class and a Raster so it seems unlikely to be suitable.
    – PolyGeo
    Commented Oct 14, 2016 at 5:22

Your Answer

By clicking “Post Your Answer”, you agree to our terms of service and acknowledge you have read our privacy policy.

Not the answer you're looking for? Browse other questions tagged or ask your own question.