5

I have a chlorophyll raster with WGS 1984 coordinate system and I reprojected it to UTM Zone 51 N using Project Raster tool and the nearest-neighbor interpolation option in ArcGIS 10.1.

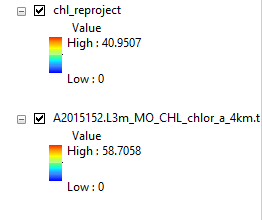
The reprojected raster values changed (WGS1984: 0-58.7058 while the UTM Zone 51 N (reproject): 0-40.9507) after the procedure (see image below). What should I do? Is that really will happen after? The chl_reproject layer is the reprojected raster (UTM Zone 51N) from the original having a coordinate system of WGS 1984 (shown beneath chl_reproject).

enter image description here

0

3 Answers 3

7

Reprojecting a raster usually warps it and ends up with a raster in which the destination cells do not correspond one-to-one to the source cells from the original raster. This means the values for the destination cells must be calculated in some way based on values of source cells.

Interpolation is the process by which values are assigned to each cell in the destination raster, based on values of the source raster cells. There are several different interpolation methods, of which 'Nearest Neighbour' is the simplest.

With Nearest Neighbour interpolation, multiple destination cells may get values from the same source cell, and some source cells may not have their values assigned to any destination cells (this is what could cause some of your source values to be missing from the destination raster). Nearest Neighbour interpolation does guarantee that all cells in the destination raster will use values from the source raster. But it does not guarantee that all values from the source raster will be used.

Each interpolation method has particular benefits and particular drawbacks and you need to consider which one best suits the particular situation (more on this below). Other interpolation methods may calculate values based on averages, weighted averages, or other forms of calculations on several source cells and may result in destination values that did not appear in the source raster at all. At least one interpolation method can even result in values outside of the range of the source values.

For a description of ArcGIS' interpolation methods, see http://support.esri.com/technical-article/000005606

If your data values represent categories, then Nearest Neighbour should be fine. However, it looks like your values represent a continuous range (guessing by the high value being non-integer 58.7058). For continuous data, you may be better off re-doing the reprojection and using Bilinear or Cubic Convolution. Bilinear will make sure that the resulting values are within the range of the source values; Cubic could end up with values outside of the original range, but will smooth out the results nicely.

0
3

Reprojection invariably involves interpolation. That, in turn, will almost always reduce the maximum and increase the minimum values in a grid when those values occur at isolated points.

Your grid has large patches of zeros, so the minimum of zero was not increased; but evidently it has an isolated maximum that was truncated because of the interpolation from its (lower-valued) neighbors that occurred.

This masks a more pervasive problem: the same thing occurs in the neighborhoods of all isolated local minima and maxima. In effect, interpolation cuts off all peaks and fills all pits and valleys. The entire terrain gets smoothed out (if only a little bit). Because local minima and maxima are not captured in the legend or by any summary statistics, these effects are often overlooked.

When you care about these details, you can do a better job by first resampling your grid to a finer resolution. This will cause the local extrema to have neighbors that have similar values. Moreover, you can control the interpolation during the resampling process (which you cannot typically do during reprojection). For instance, using "cubic convolution" will tend to maintain the values of peaks and valleys. When you reproject this finer grid, the same problems of shaving peaks and filling valleys occur--but they will not create such extreme differences. After reprojection, you can then resample to a coarser grid if you wish--but, once again, use a method like cubic convolution to avoid averaging out the peaks and valleys when you interpolate.

0
0

I suspect you need to calculate statistics on the new dataset. It hasn't sampled all the pixels in order to get the range of values.

From the documentation:

Calculating statistics allows ArcGIS applications to properly stretch and symbolize raster data for display.

Your Answer

By clicking “Post Your Answer”, you agree to our terms of service and acknowledge you have read our privacy policy.

Not the answer you're looking for? Browse other questions tagged or ask your own question.