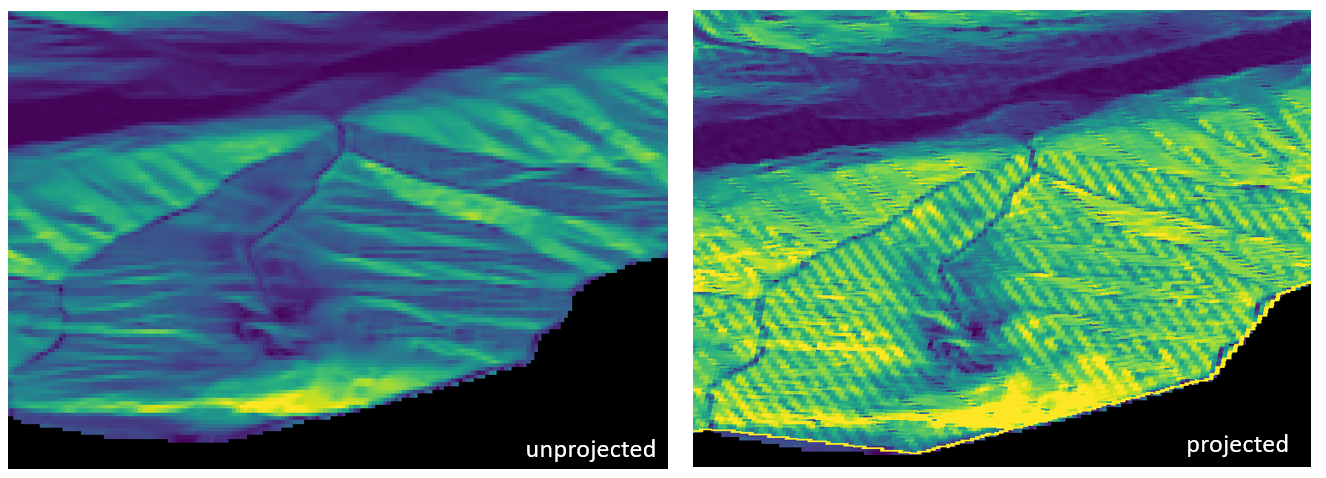
I am providing a word of caution for the other answer here by way of demonstration. I was given a DEM to perform some analysis on, and this DEM had a custom projection in feet. The next figure shows the difference in the computed slope without reprojection (left) and with reprojection (right).

You can see striping artifacts on the reprojected DEM's slope which don't appear in the original. I used a bilinear resampling scheme; perhaps cubic or higher order would reduce these effects. The scale bar is the same for both images too, showing that slopes are greatly overpredicted for the projected DEM. Note that you may have to provide a z-factor (or scaling factor) for computing slope if using WGS84.
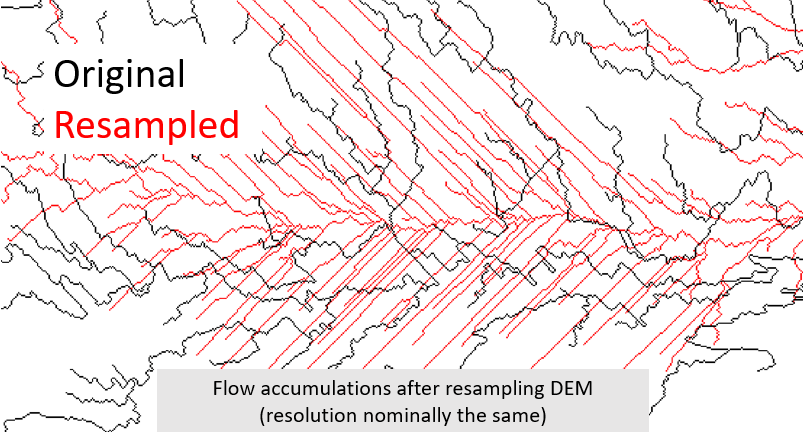
I have also seen similar behavior with the National Elevation Dataset (10 m US DEM). I don't have a figure to show for slopes, but in that case I was trying to hydrologically process the DEM. Here's a before-after example for the drainage network (thresholded at some value):

It is likely these effects could be reduced by choosing better resampling schemes or projections, but it's important to be aware of them.
My approach has generally tended toward keeping the DEM in its original CRS and grid, performing needed analyses, then reprojecting the final result to the desired CRS. Sometimes this isn't possible, and it can definitely add more work, but I feel more confident that I'm avoiding the introduction of resampling/reprojection artifacts.


