16

how can I calculate sums, averages etc of raster-points (multi-band) per polygon of a vector-layer. I was told that this is called "zonal statistics". I tried that with QGIS first.

There is a way to do it but that is much too slow (convert raster to vector, intersect with second vector-layer, calculate geometry, export numbers, calculate statistics with spreadsheet or other program, re-import the results, takes forever for my 350.000 raster-points).

I was also given the hint to use saga-gis. That has "zonal statistics" but those are based on categories from a raster-band, not on polygons from a vector-layer. So to use this I would have to convert my vector-layer to raster and then calculate the statistics.

This seems to be the wrong way to solve this. There would be no way to account for raster-points that belong to 2 or more polygons because they are intersected by the polygon-boundary. I assume that polygon-based statistics should be able to handle this so I also assume that I haven't found the correct module yet.

Saga-gis has really many modules. Please let me know which one is the right one for this application.

3
  • I'm trying Rudivonstaden's solution, and the following error messages appear when I enter the last two commands: >>> zonalstats = qgis.analysis.QgsZonalStatistics(vectorlayer,rasterfile) Traceback (most recent call last): File "<input>", line 1, in <module> AttributeError: 'module' object has no attribute 'analysis' >>> zonalstats.calculateStatistics(None) Traceback (most recent call last): File "<input>", line 1, in <module> NameError: name 'zonalstats' is not defined I'm wondering if the commands are correct or if the raster file I'm using is in the right format? Thanks!
    – Dan Wolf
    Commented Mar 26, 2013 at 16:24
  • Hi Dan. Stackexchange works a bit differently from a forum. The aim is to have a Q&A type interaction rather than an ongoing discussion. If the answers to the original question don't resolve what you need to know, you should either ask for clarification in the comments section or consider asking a new question. Commented Mar 26, 2013 at 17:10
  • Thanks for your comment, Dan. My answer was missing a necessary import statement, which should now be fixed. Commented Mar 26, 2013 at 18:54

6 Answers 6

24

I was struggling to do exactly the same thing, but for various reasons I'm committed to using QGIS. I tried using v.rast.stats using the GRASS plugin and also via the Sextante plugin. The latter approach failed, because it seems to attach the stats to a temporary vector layer which it then deletes. The GRASS plugin worked, but it doesn't deal with overlapping polygons.

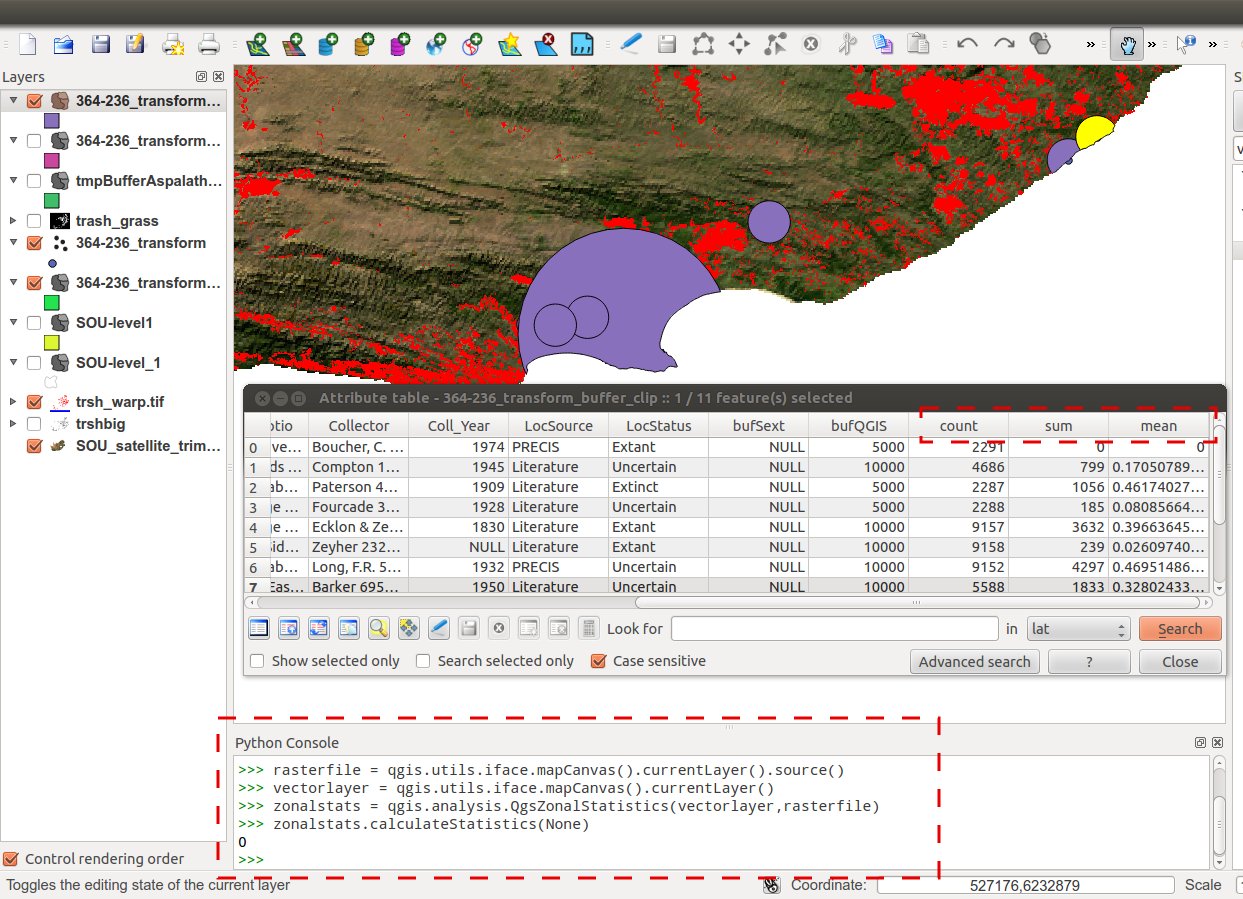
After doing some digging around (in the source of the promising-sounding ZonalStats plugin), I found that QGIS actually has zonal statistics methods built into the API, and these also have Python bindings. So as long as you are only looking for count, sum and mean statistics for your polygon features, the Python Console (Plugins > Python Console) is currently the easiest way to attach the stats to the polygon attribute table.

  1. Select your raster layer in the TOC, and type the following into the console (it grabs the source file name of your raster layer)

    >>> rasterfile = qgis.utils.iface.mapCanvas().currentLayer().source()

  2. Select your vector layer, and execute the following command in the console (it grabs the vector layer itself)

    >>> vectorlayer = qgis.utils.iface.mapCanvas().currentLayer()

  3. Execute the following three commands in the console (they pass the vector layer and raster file to QGIS' built-in zonal stats calculator)

    >>> import qgis.analysis

    >>> zonalstats = qgis.analysis.QgsZonalStatistics(vectorlayer,rasterfile)

    >>> zonalstats.calculateStatistics(None)

The results will be appended as extra fields in the polygon layer.

Zonal Statistics

Note that if you want to append a prefix to the new fields (rather than just having them as sum, mean and count), then you would replace the first command in step 3 with the following (assuming you wanted to use 'zonal_' as the prefix:

>>> zonalstats = qgis.analysis.QgsZonalStatistics(vectorlayer,rasterfile,"zonal_")
4
  • 1
    +1 qgis.analysis.QgsZonalStatistics()
    – Aaron
    Commented Oct 25, 2012 at 16:22
  • There is Zonal Statistics plugin in QGIS, so probably do not need to execute mentioned commands by yourself: docs.qgis.org/2.2/en/docs/user_manual/plugins/… I wonder, why there is no possibility to calculate maximum and minimum values as well.
    – matandked
    Commented Apr 25, 2015 at 13:04
  • I used your technique but it deletes some polygons :(
    – niahoo
    Commented Apr 14, 2016 at 14:08
  • Thanks, worked well! If you get a TypeError: QgsZonalStatistics(): Try to remove the .source() from rasterfile = qgis.utils.iface.mapCanvas().currentLayer()
    – dude
    Commented Jul 26, 2023 at 14:50
6

Finally found it: In Saga-GIS open category-polygons and data-grid, then shapes->grid->grid value->grid statistics for polygons

3

You can do this quite easily with PostGIS. See this tutorial: http://trac.osgeo.org/postgis/wiki/WKTRasterTutorial01

1
  • THX for the idea. I was hoping to get this done without adding and learning yet another software. I will keep PostGIS in mind for later though.
    – stn
    Commented Apr 12, 2012 at 17:33
3

This issue seems to have been solved already some time ago, but I´ll add my spoon to the soup anyway since I recently needed some raster stats myself.

The QGIS methodology described by rudivonstaden worked like a charm, thanks for the tip. However, in my case I also wanted to know min&max values and std for the raster values within my polygons, and that functionality I could´nt find in QGIS. I found a solution through the function isectpolyrst in GME, which is a favorite of mine for solving GIS problems with.This function gave me just the stats I needed and rather quickly as well.

PS. GME has a bit of an unfortunate dependency (ArcGIS). So even though the program itself is freely available to everyone, you need ArcGIS to run it. But if you do have ArcGIS (any level of licence), I recommend you try it out.

EDIT:

I got the stats I wanted, but I later found out that I jumped to conclusions a little hastily after looking at the actual numbers. You get stats, yes, but only for the first band in a raster. So if you operate with a 3-band raster image, the stats are incomplete. I should have pointed out the number of channels in my original post. Best to use SAGA-GIS like stn proposed above if your working with multi band raster images.

3
zonalstats = qgis.analysis.QgsZonalStatistics(vectorlayer,rasterfile)
zonalstats.calculateStatistics(None)

calculates by default just Count, Sum and Mean (as you can tell from Raster -> Zonal Statistics in QGIS Desktop, it can do a lot more).

If you, for instance, want to compute just the Mean you have to use:

zonalstats = qgis.analysis.QgsZonalStatistics(vectorlayer, rasterfile, QgsZonalStatistics.Mean)
zonalstats.calculateStatistics(None)

see API for all options.

1

The QGIS Zonal Statistics library can be used to specify the statistics to gather. Use the python interface in QGIS and run the following:

  1. Select your raster layer in the TOC, and type the following into the console

    >>> rasterfile = qgis.utils.iface.mapCanvas().currentLayer()

  2. Select your vector layer, and execute the following command in the console

    >>> vectorlayer = qgis.utils.iface.mapCanvas().currentLayer()

  3. Specify which stats you want to run from the list here. For example, here I have specified that I want the min, mean and max. Each stat you want can be added with the pipe character '|'. For this purpose it is like a list, but it's actually the bitwise or operator.

    >>> import qgis.analysis

    >>> mystats = qgis.analysis.QgsZonalStatistics.Mean | qgis.analysis.QgsZonalStatistics.Min | qgis.analysis.QgsZonalStatistics.Max

  4. Create the zonalstats object using the raster and vector layers, and the stats you specified

    >>> zonalstats = qgis.analysis.QgsZonalStatistics(vectorlayer,rasterfile,stats=mystats)

  5. Finally run the statisitcs.

    >>> zonalstats.calculateStatistics(None)

The results will be appended as extra fields in the polygon layer.

Your Answer

By clicking “Post Your Answer”, you agree to our terms of service and acknowledge you have read our privacy policy.

Not the answer you're looking for? Browse other questions tagged or ask your own question.