I am using the Zonal Stats plugin in QGIS to extract raster statistics from overlaying polygons (I have shapefiles of species distribution and I want to extract environmental data from within each species' range). I have 300 or so files I need to get data from and so would like to write a script to run in the python console, however I am a complete novice with python and have no idea how to do this.
-
possible duplicate of Running a Python Script to Extract Raster Data in QGIS– Chad CooperCommented Jan 5, 2013 at 14:36
-
Chad - yes it's a similar question but its more specific. No one has answered the other question, instead they suggested other ways of solving the problem. I don't know how to delete the other post– ThomasCommented Jan 5, 2013 at 16:46
-
In the other question i pointed you to a r-script capable of what you want and Sylvester Sneekly named you the exact method in python. If you aren't used to code in either python or r than all further hints won't help you. You need a self-coded script or a lot of mouseclicks. Learn some coding, try the examples and report back, if something doesn't work.– CurlewCommented Jan 5, 2013 at 16:47
-
@Curlew - Sylvester's method, while it sounds very good, would represent a massive learning curve for me and I don't have time to do this at the moment. I appreciate Sylvester's help but it wasn't the straightforward answer I was after. I though I had most of the code I was after in the post I mentioned in my other question (gis.stackexchange.com/questions/23203/…). If Sylvester's method is the only way to do this in python maybe I underestimated how difficult it would be.– ThomasCommented Jan 5, 2013 at 17:23
-
@Curlew - Your R script does indeed work, thank you. The only thing I've yet to work out is how to append the results returned in R to the .dbf file for my shapefiles (any help with this would be much appreciated).– ThomasCommented Jan 5, 2013 at 17:23
3 Answers
You might modify this to accommodate multiple files with some loop.
from qgis.analysis import QgsZonalStatistics

#specify polygon shapefile vector
polygonLayer = QgsVectorLayer('F:/temp/zonalstat/zonePoly.shp', 'zonepolygons', "ogr")

# specify raster filename
rasterLayer = QgsRasterLayer('F:/temp/zonalstat/raster1.tif')

# QGIS 3.22.6 - QgsZonalStatistics(QgsVectorLayer *polygonLayer, QgsRasterLayer *rasterLayer, const QString &attributePrefix=QString(), int rasterBand=1, QgsZonalStatistics::Statistics stats=QgsZonalStatistics::Statistics(QgsZonalStatistics::Count|QgsZonalStatistics::Sum|QgsZonalStatistics::Mean))
zoneStat = QgsZonalStatistics(polygonLayer, rasterLayer, 'pre-', 1)
zoneStat.calculateStatistics(None)
-
Great. Thank you very much vinayan, that's exactly what I was after.– ThomasCommented Feb 6, 2013 at 15:36
-
-
-
@vinayan the QProgressDialog is useful for visual environments where you want to see how far the calculations have progressed. It has no use from the command line. You can use
Noneas the parameter and it works fine. Then you don't need the fromPyQt4..line or theprogressDialog =line. See similar post at gis.stackexchange.com/questions/23203/… Commented Mar 26, 2013 at 20:19 -
@rudivonstaden - that makes sense now..i updated the answer– vinayanCommented Mar 27, 2013 at 6:45
zoneStat = QgsZonalStatistics (polygonLayer, rasterFilePath, 'pre-', 1)
zoneStat.calculateStatistics(None)
calculates by default just Count, Sum and Mean (as you can tell from Raster -> Zonal Statistics in QGIS Desktop, it can do a lot more).
If you, for instance, want to compute just the Mean you have to use:
zoneStat = QgsZonalStatistics (polygonLayer, rasterFilePath, 'pre-', 1, QgsZonalStatistics.Mean)
zoneStat.calculateStatistics(None)
see API for all options.
-
Can anyone help with the syntax for getting two statistics of choice, say Min & Max, at the same time? I've been trying different ways but no success Commented Sep 11, 2019 at 7:21
-
In Qgis 3 you need to replace the raster file path with the raster file itself! Therefore, rasterFilePath = 'F:/temp/zonalstat/raster1.tif' becomes: rasterFile = QgsRasterLayer('F:/temp/zonalstat/raster1.tif', 'raster') Then you change the rasterFilePath to the rasterFile in the zoneStat command zoneStat = QgsZonalStatistics (polygonLayer, rasterFile, 'pre-', 1) zoneStat.calculateStatistics(None)– philschCommented Sep 16, 2019 at 15:03
-
@dorakiara maybe [QgsZonalStatistics.Min, QgsZonalStatistics.Max] ? Commented Apr 13, 2022 at 17:51
Here is way to get what you want in SAGA GIS. This probably isn't the solution you want, but it works. I'll look into the reasons why my plugins fails and update it as soon as possible.
Install SAGA GIS (should also be available via apt-get or aptitudbe in your linux distribution).
- Start SAGA, load in your Raster and vector shape (Menu Modules -> File -> GDAL/OGR import). You can see the process below.
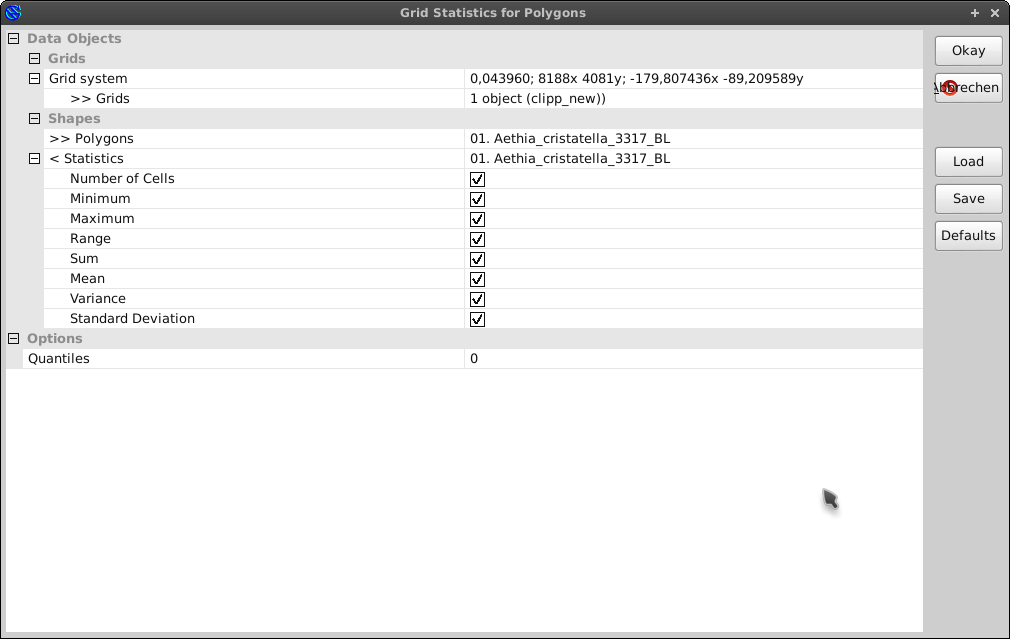
- Execute Module "Grid statistics for polygons" (Menu Modules -> Shape -> Grid -> Grid-values). Values are added directly to the table.
The Dialog should look like this

- Go to the tab "Data" in the workspace, rightclick on your vector layer and choose to "save as" to export the shape with the added attributes. You could also display the attribute table via rightclick and then click on table show
This works for the dataset you sent me. It is also possible to call SAGA modules in QGIS via SEXTANTE as a BATCH process. To do this simply activate the SAGA modules in the SEXTANTE options.
-
thanks for the suggestion but I've already tried saga - the results it produced were inconsistent i.e. doing the same thing twice gave different results. I know the ZonalStats plugin in QGIS works, hence I'm after a way to automate ZonalStats.– ThomasCommented Jan 7, 2013 at 13:58
-
@vinayan i have the code which u have given for zonal statastics but it is creating the columns in the polygon vector layer but not updating the calculated values. Why is it so?– user99Commented Jul 24, 2015 at 7:41
