2

I'm trying to reduce the amount of physical field pickup for a feature survey plan by flying the property, tracing over the point-cloud and exporting the linework out as a DXF so I can edit it in my CAD software (12D model, not a huge following for it's drafting ability, very good for survey work though)

I've been able to do the following;

  • Create a custom CRS for the map projection that we use for the bulk of our survey work and what Photoscan also uses
  • Import the georeferenced orthometric photo as a raster layer
  • Import the georeferenced DEM as a raster layer and set transparency to 50% so I can see my "base map" underneath
  • Create and draw lines by Shapefile Layer (even if I don't fully get the fields list at this stage)
  • Export the Shapefile as a DXF, with correct CRS (I know it's right as when I view it on my CAD software it sits exactly as it should, 2D anyway) with Geometry type with several types (LineString/Polygon/GeometryCollection) with "Include z-dimension" ticked

I can import it in fine, 2D sits fine, but there is no height attached. I am, probably naively, thinking that since I'm tracing over the DEM then there should be z-values attached but obviously there isn't.

Is there something I'm missing out on?

2
  • I think the step missing between 'create and draw lines...' and 'export...' is that you have to extract z values to that line. It is not automatically done by clicking 'include z-dimension' on export. There has to be a process for writing the elevation into the geometry of the lines. Unfortunately, I don't know how to do that with QGIS at the moment.
    – Tangnar
    Commented Apr 25, 2017 at 20:26
  • Thanks Tangnar, at least that's something I can look into, cheers
    – W.C.A.I
    Commented Apr 26, 2017 at 4:05

1 Answer 1

1

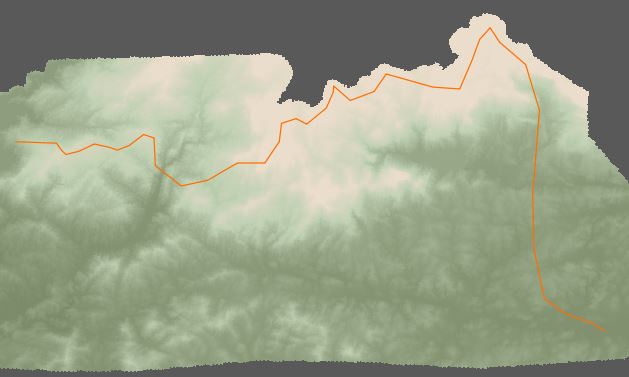
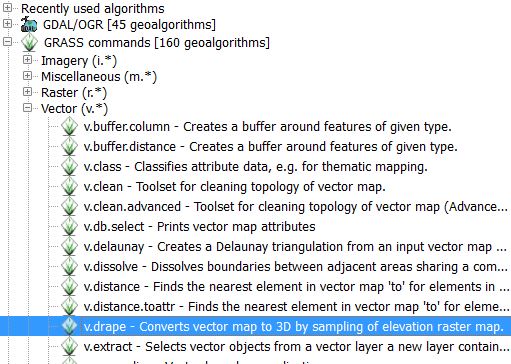
I found the way to do this in QGIS. The tool is in GRASS commands, and is called v.drape. I tested it out, and when I view details about the geometry, it the output is a line that has Z values.

I also tested the output by calculating the z geometry into the attribute table, as described here. The calculated z values matched when I identify the raster cells at the same location.

line on a DEM v.drape in the toolbox

1
  • Thank you very much Tangnar, I will try this tonight and report back but it looks exactly like what I am after :)
    – W.C.A.I
    Commented Apr 28, 2017 at 3:20

Your Answer

By clicking “Post Your Answer”, you agree to our terms of service and acknowledge you have read our privacy policy.

Not the answer you're looking for? Browse other questions tagged or ask your own question.