2

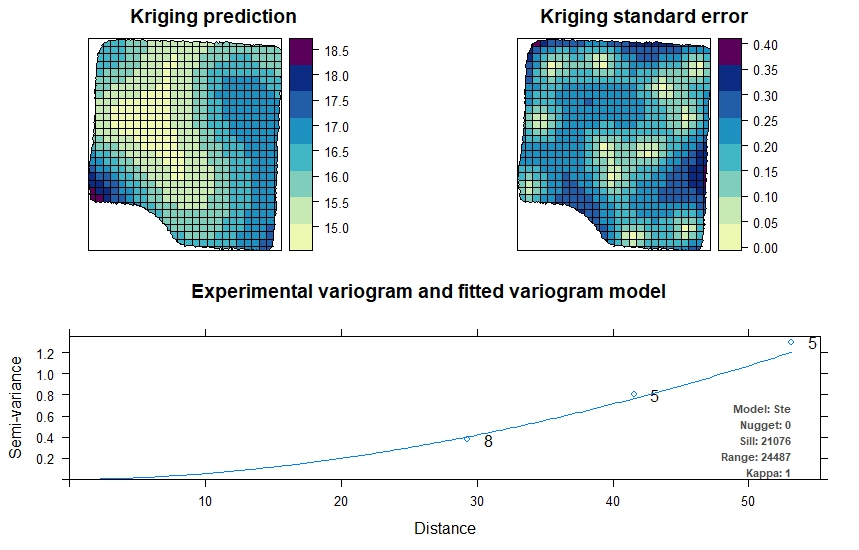
I have performed Kriging using the autoKrige function, that is part of the automap package in R.

I obtained this as my output

enter image description here

I have realized that maybe the reason why I can not export the Kriging prediction plot is because the grid that I setup (to performed kriging) is somehow wrong.

library(rgdal)     
library(ggplot2)   
library(ggmap)
library(GISTools)
library(sp)
library(gstat)
library(automap)
library(raster)  
library(reshape2)

all.data<-read.csv("E:/Juan Arango/All_Data_Fall_17.csv", header=TRUE)
all.data
dput(data.frame(all.data)[,c("Lat","Lon","Secchi.Disk")])
coordinates(all.data)<- ~ Lat + Lon
class(all.data)

#Setup the gird
grid <- raster(extent(WWWL.Shape))
res(grid) <- 5
proj4string(grid)<-proj4string(WWWL.Shape)
gridpolygon <- rasterToPolygons(grid)
dry.grid <- intersect(WWWL.Shape, gridpolygon)
plot(dry.grid)

#AutoKriging SD
SDVar <- autofitVariogram(Secchi.Disk~1, all.data)
summary(SDVar)
plot(SDVar)
SDKrig <- autoKrige(Secchi.Disk~1, all.data, dry.grid)
plot(SDKrig)
plot(SDKrig$krige_output[,"var1.pred"])

Output dput(data.frame(all.data)[,c("Lat","Lon","Secchi.Disk")])

>dput(data.frame(all.data)[,c("Lat","Lon","Secchi.Disk")])
structure(list(Lat = c(334374, 334381, 334391, 334423, 334426, 
334431, 334465, 334455, 334444, 334481, 334481, 334489), Lon = c(4088957, 
4089003, 4089040, 4089041, 4088984, 4088965, 4089025, 4088982, 
4088924, 4088929, 4089004, 4089039), Secchi.Disk = c(18L, 15L, 
16L, 15L, 15L, 15L, 17L, 16L, 16L, 17L, 17L, 16L)), .Names = c("Lat", 
"Lon", "Secchi.Disk"), class = "data.frame", row.names = c("1", 
"2", "3", "4", "5", "6", "7", "8", "9", "10", "11", "12"))  

Output plot(SDKrig$krige_output[,"var1.pred"]) enter image description here
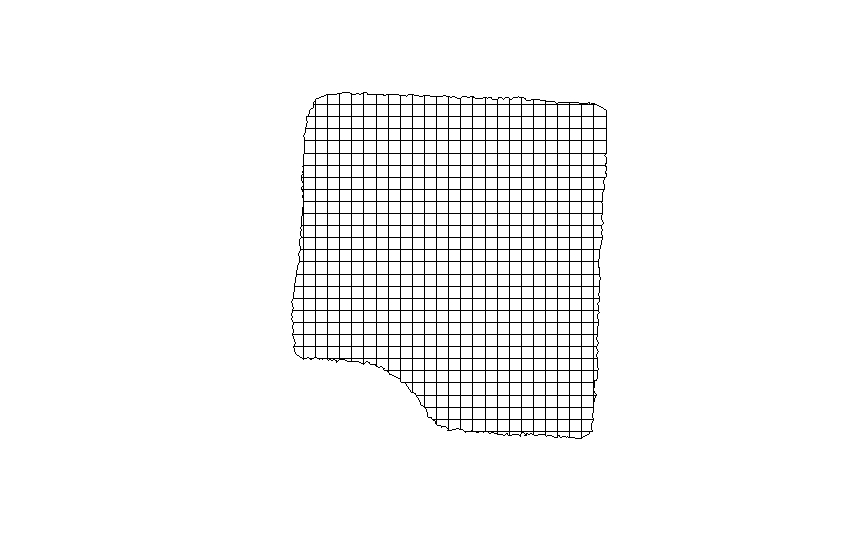
Any ideas on how fix this? Could it be related to way I setup the grid?

4
  • 3
    Possible duplicate of Exporting kriging prediction map in .asc format? Commented Nov 6, 2017 at 23:11
  • @AndreSilva thank you for your response. I have realized that maybe the issue that I am having is how I setup the grid that I am using... maybe?
    – Perro
    Commented Nov 6, 2017 at 23:47
  • After you edited your question it became unclear to me what you are trying to do. Commented Nov 6, 2017 at 23:48
  • @AndreSilva sorry for the confusion. Please allow me to explain you better. I used the autoKrige function in order to performed Kriging (as I mentioned in my original post). After reading your comment, I realized that maybe the reason why I can not export the kriging prediction plot (created by using the autoKrige function) is because the grid that I setup and is somehow not right? So I guess my question now is, is there something wrong with the grid that I created? Thank you
    – Perro
    Commented Nov 7, 2017 at 0:01

2 Answers 2

3

You will not be able to export symbology from the plot function, only the raster(s). This is not a shapefile (polygon, point, line) but rather a raster format. Whereas there are steps to convert to a point object that can be exported as a shapefile, this is not desirable.

The class of the output from automap::autoKrige is a SpatialPixelsDataFrame (sp raster class object) and can be exported to a raster format using writeGDAL in rgdal or writeRaster in the raster package(s).

library(automap)
  data(meuse)
  coordinates(meuse) =~ x+y
  data(meuse.grid)
  gridded(meuse.grid) =~ x+y

kriging_result = autoKrige(zinc~1, meuse)
  class(kriging_result$krige_output)
  names(kriging_result$krige_output)

# export using raster
library(raster)
writeRaster(raster(kriging_result$krige_output, "var1.pred"), "pred.var.tif", options="COMPRESS=LZW")

# export using rgdal
library(rgdal)
writeGDAL(kriging_result$krige_output[,"var1.pred"], "pred.var.tif")
1

The $krige_output component is a SpatialPointsDataFrame object holding the estimates and the standard errors. You can then export this to shapefile (or anything else) in the usual ways.

Reproducible example from the help:

data(meuse)
coordinates(meuse) =~ x+y
data(meuse.grid)
gridded(meuse.grid) =~ x+y

# Ordinary kriging, no new_data object
kriging_result = autoKrige(zinc~1, meuse)
plot(kriging_result$krige_output)

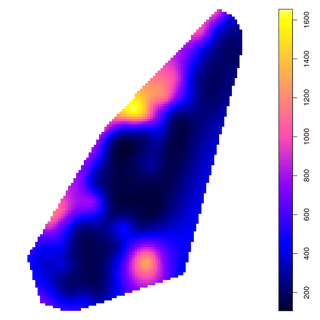
will plot the kriging predictions:

enter image description here

plot(kriging_result$krige_output[,"var1.pred"])
plot(kriging_result$krige_output[,"var1.var"])

similarly plot the predictions and the variances.

3
  • thank you for your response. However, after using plot(kriging_result$krige_output[,"var1.pred"]) I only get the .shp file that I imported with the grid, not the kriging predictions plot witht the legend and colors. If there anything else that I need to add to that code?
    – Perro
    Commented Nov 6, 2017 at 22:24
  • Without seeing some of your code we can't help much.
    – Spacedman
    Commented Nov 6, 2017 at 22:34
  • I have realized that maybe the issue that I am having is how a setup the grid that I am using... maybe?
    – Perro
    Commented Nov 6, 2017 at 23:28

Your Answer

By clicking “Post Your Answer”, you agree to our terms of service and acknowledge you have read our privacy policy.

Not the answer you're looking for? Browse other questions tagged or ask your own question.