I'm new with GIS in R, and I'm facing a problem I really do not understand...
The aim is easy : I have dataset of GPS points (decimal) located on a Mediterranean island, and I want to extract Bioclim data for each point.
My dataset looks like this
loc
    code    municipality        x        y status balea
1   AHO1         Alghero 8.243606 40.61025      m   bal
2   AHO2         Alghero 8.175231 40.62431      m   bic
3   AHO3         Alghero 8.236722 40.61369      m   bal
4   AHO4         Alghero 8.236989 40.62351      m   bal
5   AHO5         Alghero 8.242231 40.61663      m   bal
6   AHO6         Alghero 8.239211 40.61161      m   bal
7   AHO7         Alghero 8.249450 40.61243      m   bal
8   ASI1    Porto Torres 8.305914 41.09242      m   bal
9   MAC1         Macomer 8.705692 40.24535      m   bal
10   MAD  Santulussurgiu 8.619711 40.16222      m   bal
11   MON       Montresta 8.526969 40.37630      m   bal
First, I create a map of Sardinia using function "map"
zone.etude <-map("world", regions="Italy:Sardinia", exact=TRUE,fill=T)
IDs <- sapply(strsplit(zone.etude$names, ":"), function(x) x[1])
zone.etudeSpp <- map2SpatialPolygons(zone.etude, IDs=IDs, proj4string=CRS("+proj=longlat +datum=WGS84"))
e <- extent(zone.etudeSpp)
Then, I create a raster stack with bicolor variables
for (i in 1:19) {
  r<-raster(paste("bio_",i,sep=""), proj4string=CRS("+proj=longlat +datum=WGS84"))
  r.crop=crop(r, e)
  r.mask=mask(r.crop,zone.etudeSpp)
  assign(x=paste("r.crop_",i,sep=""),value=r.mask)
}
predictors=stack(r.crop_1,r.crop_2,r.crop_3,r.crop_4,r.crop_5,r.crop_6,r.crop_7,r.crop_8,r.crop_9,r.crop_10,r.crop_11,r.crop_12,r.crop_13,r.crop_14,r.crop_15,r.crop_16,r.crop_17,r.crop_18,r.crop_19)
projection(predictors) <- "+proj=longlat +datum=WGS84"
The issue appears now : when I use extract to get data for GPS points, the first 8 locations get NA...
val.bioclim = extract(predictors, loc[,3:4],cellnumbers=TRUE)

> val.bioclim
      cells bio_1 bio_2 bio_3 bio_4 bio_5 bio_6 bio_7 bio_8 bio_9 bio_10 bio_11
 [1,]   587    NA    NA    NA    NA    NA    NA    NA    NA    NA     NA     NA
 [2,]   586    NA    NA    NA    NA    NA    NA    NA    NA    NA     NA     NA
 [3,]   587    NA    NA    NA    NA    NA    NA    NA    NA    NA     NA     NA
Exactly as if they would "fall into the sea"... [I know 2 of them are out of the raster extent, as they come from small islets not included in Bioclim. But the remaining 6 are definitely far from shore]
So I decided to first check both projections
> proj4string(predictors)
[1] "+proj=longlat +datum=WGS84 +ellps=WGS84 +towgs84=0,0,0"
> proj4string(zone.etudeSpp)
[1] "+proj=longlat +datum=WGS84 +ellps=WGS84 +towgs84=0,0,0"
They seem quite coherent, as they are all expressed in longlat and WGS84.
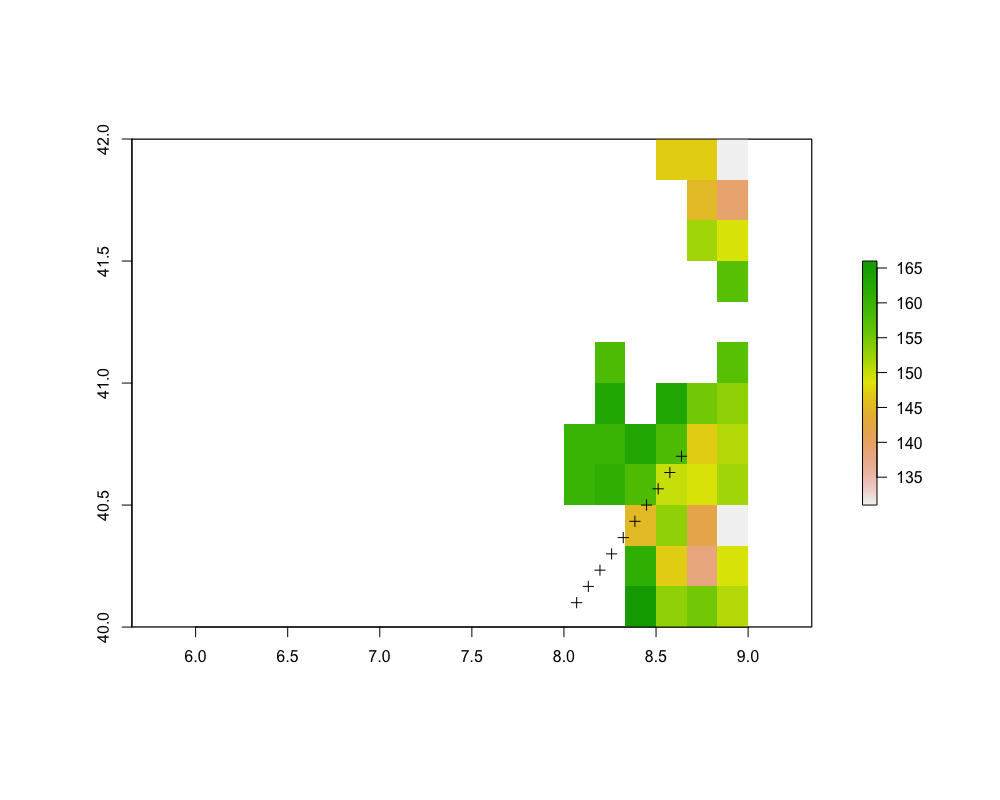
Then I made a map using plot, and that's where things went wrong
plot(predictors$bio_1)
plot(zone.etudeSpp, add = T)
points(loc[,3:4], pch = 16, cex = 0.6)
If I check the plot in my Rstudio window, everything looks OK, all point fall "inland" within the extent of the "predictor" raster, and the edge of both layer (predictors$bio1 and zone.etudeSpp are superposed)... but when I export the map in PDF, my points and zone.etudeSpp seems to be in the same projection, but are completely stretched toward N and S... which is not the case for the predictor plot. Thus I can see my 8 first points "falling into the sea".
[I'm struggling to add picture but I've screen shot if this to make it clearer... just don't know how to add them]
I'm quite lost,
Is it a problem with CRS? I thought both maps and my GPS locations were expressed in the same system
Is it a problem with my computer, or R version? I have updated all my packages this afternoon.
Guillaume

